
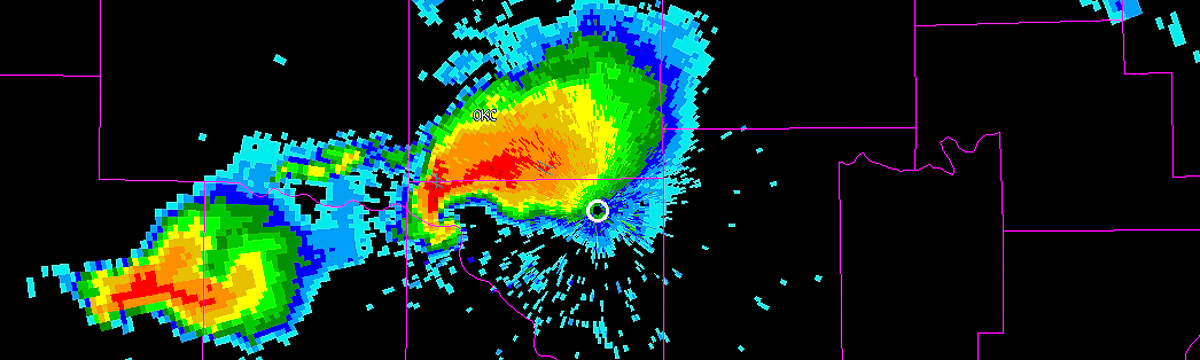
There seems to be some confusion about the geolocation of WDSS-II’s grids. First of all, most of the grids produced by WDSS-II algorithms are in Plate Carree (or equirectangular) projection for the reasons ably set forth in this cartoon.
Suppose you were to ask w2merger to make you a grid from radar data and you specify the top (northwest) corner with -t and bottom (southeast) corner with -b and spacing with -s as (35,-97), (34.97, -96.97) and (0.01,0.01) respectively. You would then get this 3×3 grid:
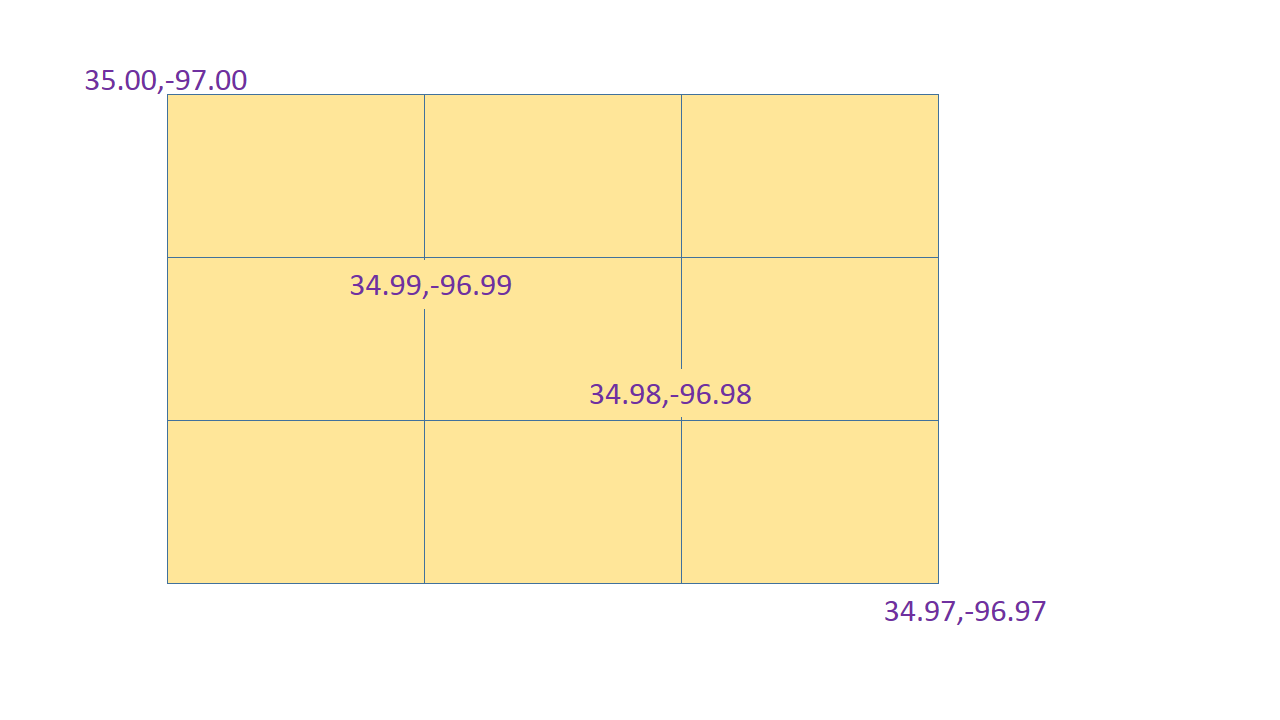
I have found that if you consider that all pixels occupy a definite area of the earth, the above representation becomes very logical. It is also intuitive in that there are 3 pixels between 35 degrees and 34.97 degrees at a spacing of 0.01 degrees.
In the netcdf files output by WDSS-II, you will find that the northwest corner and the grid spacing for the above grid would be encoded as (35,-97) and (0.01,0.01).
So, are the pixels in WDSS-II defined by their north-west corners? Unfortunately, no. For that, you have to take into account that while a pixel occupies a certain area, it has only one value. Which location within the pixel does that value correspond to? The value of a bin is the average value within the region covered by that bin.
The answer to the second question leads to some tricky semantics. Before we get to those, let’s move on from the world geographic system to the projected coordinate system of the grid itself (see ArcGIS for an explanation of the difference). Because the projection in question is Platee Carree, the transformation is a simple linear one between pixel coordinates and latitude-longitude, but such a transformation exists. For this coordinate system, the (0,0) point is the center of the northwest grid point. This is needed so that we can think of a pixel’s value as being the average value within the bin if we had somehow had infinite resolution. The grid’s coordinate system, to put a picture to it, is like this:
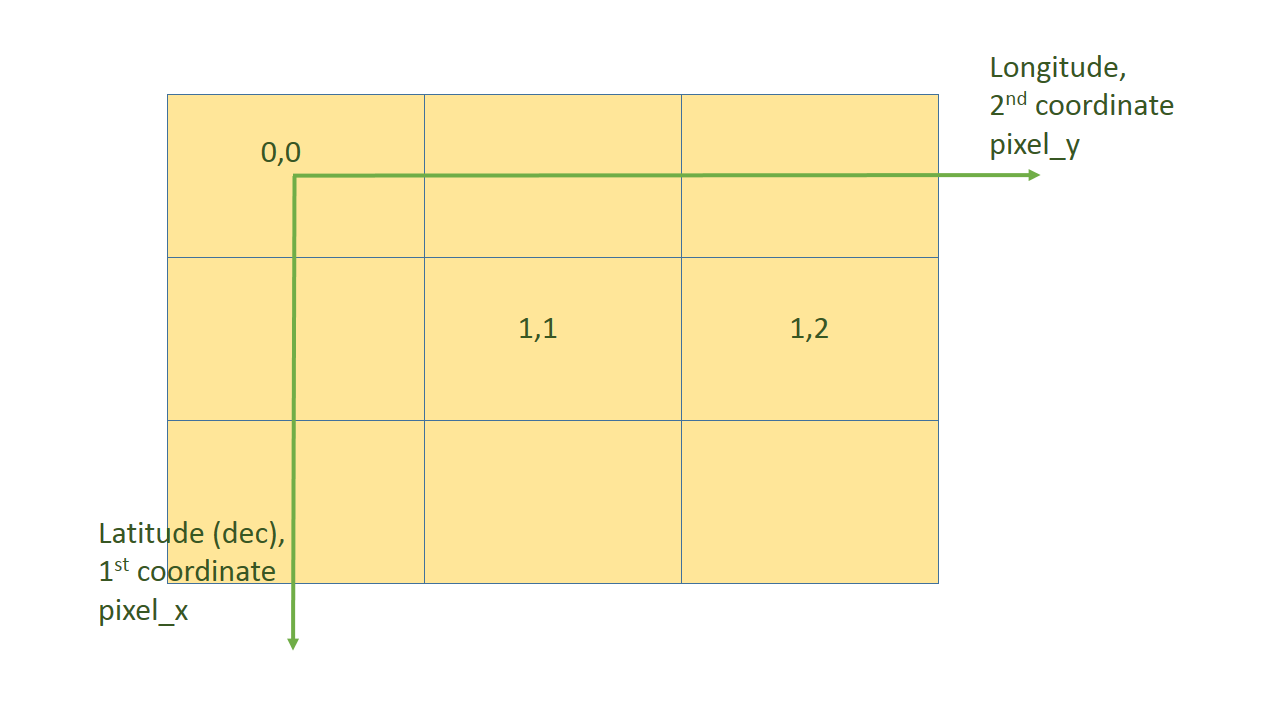
A couple of things may warrant noting. The first coordinate (the slower-changing one) is the latitude direction and the second coordinate (the faster changing one) is the longitude one. In other words, grid values are written starting from the northwest corner in rows. Confusingly, the first coordinate (the “vertical” one if you are staring at an image) is called the x-axis in the sparse-grid netcdf format (“pixel_x”) and is the coordinate we ask for first on all command-lines that ask for a position or length. [Side note: This is because my background is in image processing and linear algebra where this right-handed coordinate system is common. By the time I figured out that meteorologists and computer graphics used “x” for the “horizontal” dimension, it was too late and there was too much code written with the matrix notation firmly in place.]
The two definitions above are very intuitive, and if you don’t think much about it, you will probably end up doing the right thing. But just to make sure you are thinking about this the right way, try to answer this question. Given the grid above, what is the value at the location denoted by a star in this diagram?

To find the nearest neighbor to a point (lat,lon) you would start by computing floor( (nwlat-lat)/deltalat ) to get the first pixel coordinate and floor( (lon-nwlon)/deltalon ) to get the second pixel coordinate. If you wished to interpolate, you would also compute the ceil() besides computing the floor() so that you get the four pixels in question. Then, you would compute the distance of the stars from the pixel centers to get distance-weights and then compute a weighted average of the four values.