MRMS QPE Performance During Imelda – A Quick Look

Only two years after the historic rainfall from Hurricane Harvey, the nearly stationary movement from the remnants of Tropical Storm Imelda produced another catastrophic flood event over southeast Texas. Convective features being fed by an unstable atmospheric environment and the warm waters of the Gulf of Mexico produced rain rates of 4-6 inches per hour. Localized rainfall accumulations of over three feet were recorded. Most of this rainfall fell within a 24-hour period.

The experimental version of MRMS, designated as MRMS v12.0, produced a considerably accurate depiction of the rainfall over southeast Texas (Table 1). Analysis shown below is focused on the 24-hour period ending 1200 UTC 19 September 2019. The MRMS QPEs were compared against independent CoCoRaHS observations. The operational version of the MRMS radar-only QPE that is based only on reflectivity had some general overestimation bias for the period of greatest rainfall. The MRMS v12.0 dual-pol synthetic radar QPE with evaporation correction produced greater totals between Beaumont and Winnie, TX, but had overall better statistical values with some overestimation bias. The maximum 24-h value shown with the experimental dual-pol synthetic QPE product was 36.62 inches.
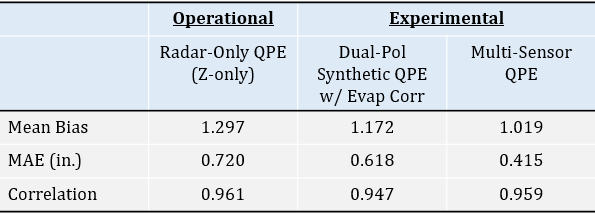
Table 1: Statistical analysis of various MRMS QPE products over southeast TX for the 24-h period ending 1200 UTC 19 September 2019.

The experimental MRMS dual-pol synthetic radar QPE with evaporation correction is fed into the next update for the Flooded Locations and Simulated Hydrographs (FLASH) system, which is available at http://flash.ou.edu/. The extreme rainfall rates and accumulations created off-the-chart values for the CREST maximum unit streamflow values (Figure 1); yet, the over 1000 water rescues, countless road closures, and numerous evacuations justify the extreme hydrologic values.

Figure 1: FLASH CREST maximum unit streamflow based on the MRMS v12.0 dual-pol synthetic QPE with evaporation correction at 1100 UTC 19 September 2019.

The MRMS v12.0 Multi-Sensor QPE, which gauge-corrects the radar data while gap-filling radar coverage, had a near-perfect bias at 1.018 with lower statistical errors. The maximum 24-h value over the period ending 1200 UTC 19 September 2019 was 34.10 inches. The overall 72-h total from the period ending 1200 UTC 20 September 2019 using the MRMS v12.0 Multi-Sensor QPE is shown in Figure 2. There is a significant area of 18+ inches of rainfall stretching from near The Woodlands to the Texas/Louisiana border. Over three feet of rain fell from west of Winnie, TX to Beaumont, TX. The maximum three-day total from the experimental MRMS Multi-Sensor QPE was 45.70 inches.
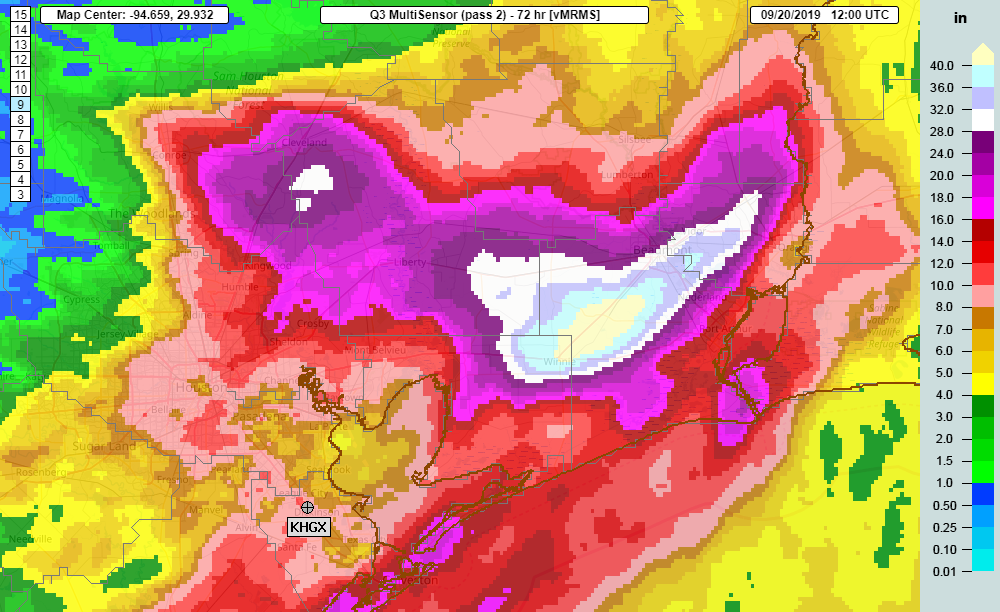
Figure 2: Three-day total of the MRMS v12.0 Multi-Sensor QPE ending 1200 UTC 20 September 2019.

The experimental MRMS v12.0 product suite will be operationally implemented in the National Weather Service in Q4 of FY20; however, local NWS office can pull the MRMS v12.0 data from their regional headquarters for testing and evaluation. The experimental MRMS v12.0 data can also be viewed on the web at https://mrms.nssl.noaa.gov/qvs/mrms_v12/index.php.

Tags: None

MRMS Experimental QPE During Hurricane Dorian

Hurricane Dorian will go into the record books as one of the most powerful tropical cyclones in the history of the north Atlantic basin. The very slow forward motion over the Bahamas has produced catastrophic damage from the sustained Category 5 winds and 20+ foot storm surge, yet the slow storm motion has produced another significant hazard over the region… prolonged rainfall. This is similar to what has been observed with Harvey (2017) and Florence (2018). The forward motion of Dorian has been 10 knots or less for the past five days, including a period of being stationary over Grand Bahama.

So how much rain could have fallen with this system in that region?

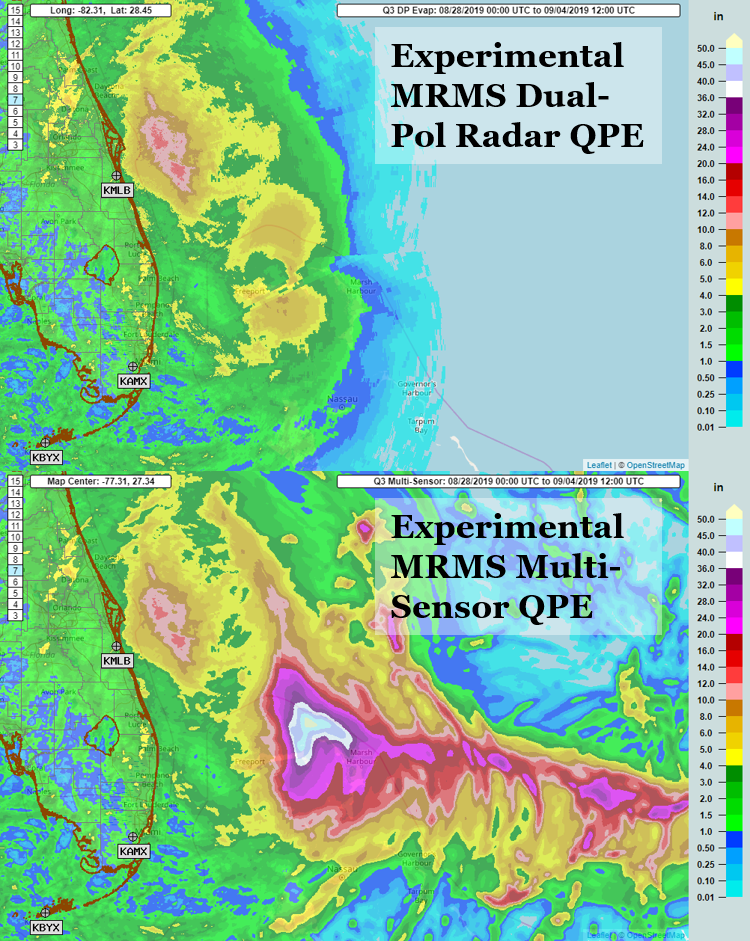
Given the lack of gauge observations and radar data over the Bahamas, it is hard to determine from the current NEXRAD radar fleet. The top image shown here depicts the rainfall from our WSR-88D radars using the experimental MRMS dual-pol synthetic QPE with evaporation correction. Dorian passing near the east coast of Florida allowed for better sampling, resulting in the product estimating over 12 inches of rain offshore and 4-6 inches of rain inland with the outer bands. But you get very poor representations of radar near the center of the storm track and areas eastwards; moreover, you cannot properly depict the potential rainfall over the Bahamas at this far range.

The experimental Multi-Sensor QPE in MRMS utilizes other near real-time sources to compensate for this. In this case with Dorian, the 1-h forecast QPF from the HRRR is the input that supplements the radar QPE. The estimated totals are astonishing, with 20-40 inches of rain over the islands with approximately 50 inches of rain over open water. Researchers will continue to evaluate these products and investigate how to keep improving the experimental product suite. Other efforts are ongoing to investigate additional observational sources in the real-time MRMS system to feed into such products as the Multi-Sensor QPE.

Comparison of experimental MRMS dual-pol synthetic radar QPE with evaporation correction versus the experimental MRMS multi-sensor QPE for the period of 0000 UTC 28 August to 1200 UTC 4 September 2019 (total period of 7.5 days).


Tags: None

Hail Caps and Rain Rates

One of the bigger challenges with estimating precipitation is when hail is present. The presence of hail gives a different signal in many radar products, which impacts the ability to use radar to accurately provide a liquid accumulation value. In the operational version of MRMS, a hail cap is used in identified hail cores (i.e., where the Maximum Expected Size of Hail, or MESH, product is non-zero) by capping the precipitation rate a 2.12 inches per hour. While the hail cap was designed to prevent some overestimations of QPE, it has also created some significant underestimations as well.

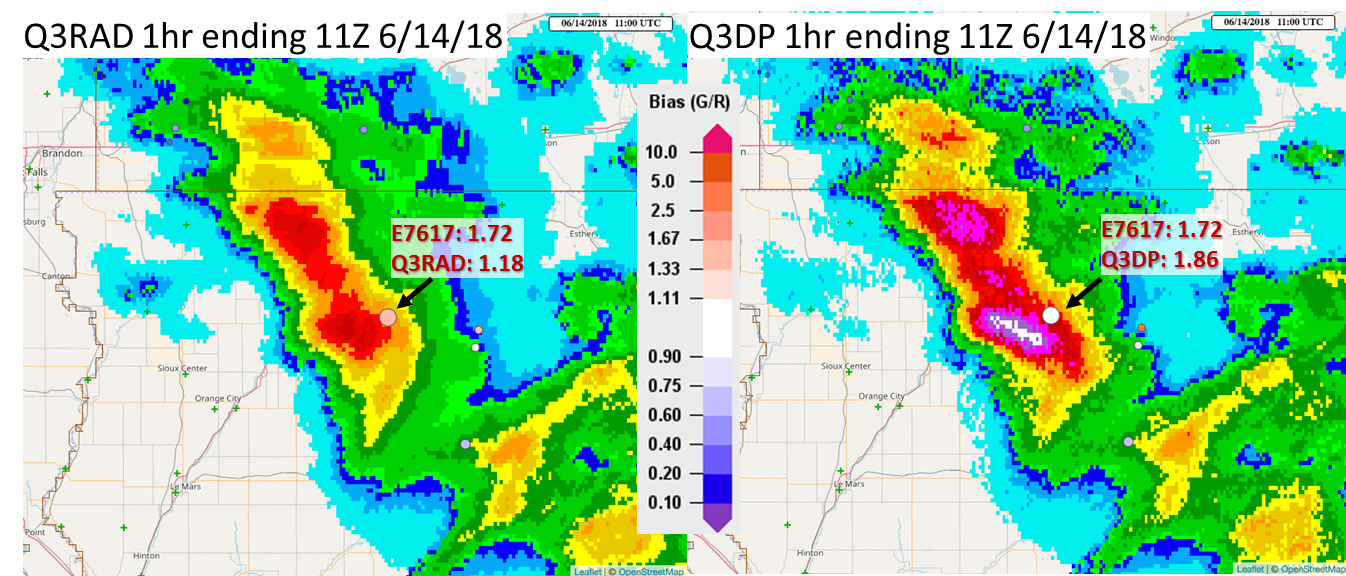
In the upcoming build of MRMS, two changes will be made to mitigate the issues of hail contamination. The first is in the creation of the new MRMS dual-pol synthetic QPE. Instead of using reflectivity to estimate precipitation, hail cores will utilize specific differential phase (KDP) to better estimate rainfall in these convective storms. The image below shows how the hourly rainfall estimation is improved using this technique. The second is to reduce the impacts of the hail cap for MESH with the reflectivity-based approach by linearly increasing the influence of the hail cap from MESH = 0.01 inch per hour to MESH = 1.00 inch per hour. This would be applied in areas where radar coverage is degraded or if there are technical issues impacting the dual-polarization products from a radar.

One-hour QPE ending at 1100 UTC 14 June 2018 for the operational Z-only MRMS radar QPE (left) and the experimental MRMS dual-pol synthetic radar QPE (right). The gridded MRMS QPE values are compared against gauge E7617.
Tags: None

Storm Total Rainfall Accumulations for Upcoming Tropical Cyclones

There are two big rainfall impacts from tropical cyclones that will occur over the next few days in the continental United States. The first and greatest impact will be from Hurricane Florence with the forecast of 20+ inches of rain in the Carolinas. There is a also a tropical disturbance moving towards southern Texas with the forecast of 7+ inches of rain on top of already saturated soils.

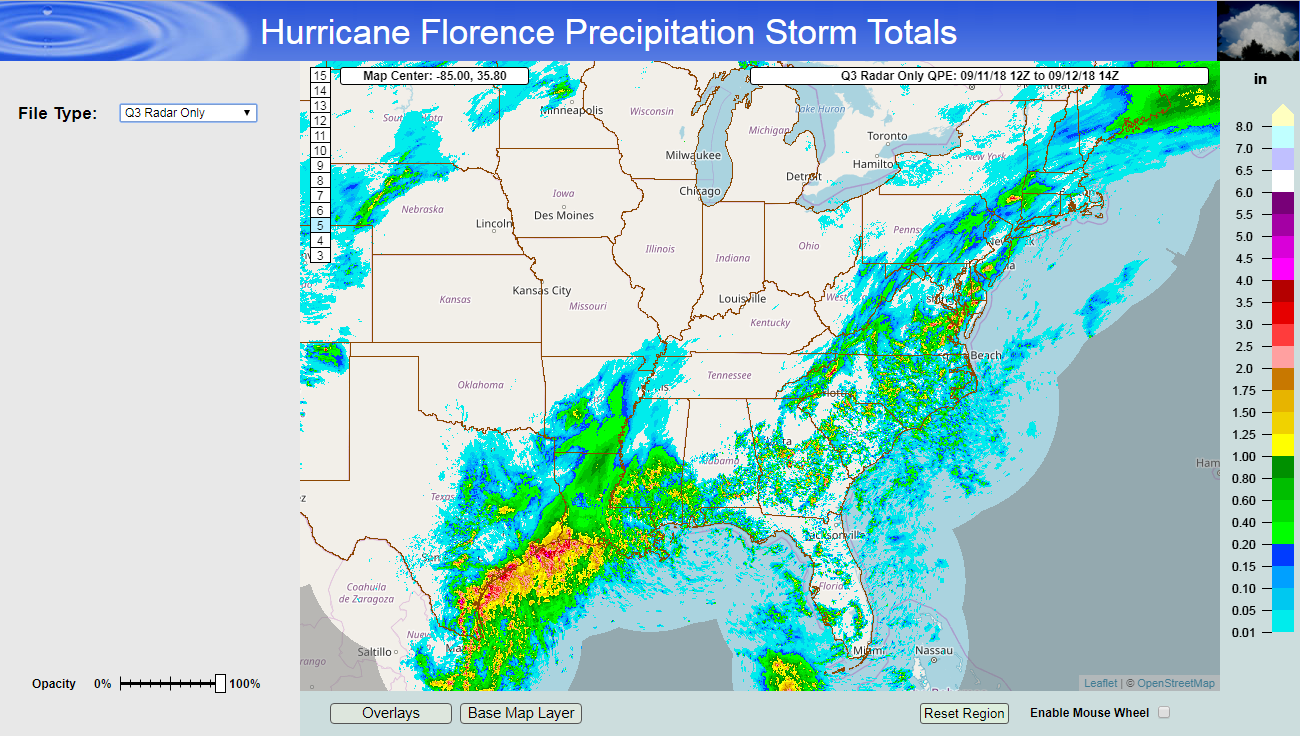
The MRMS group at NSSL has developed a web page displaying the storm total accumulations for select experimental MRMS v12.0 precipitation products. The rainfall accumulations provided on the web site starts at 0000 UTC 13 September 2018 (8:00PM EDT 12 September). These products will continue to accumulate on this page until further notice.

https://mrms.nssl.noaa.gov/qvs/florence/

Tags: None

QPE Performance During the South TX Flash Flooding

The week of June 18, 2018 had series of high-impact flash flood events across the United States. One of the more prominent events occurred in southern Texas as a result of a nearly stationary tropical wave that moved in from the western Gulf of Mexico.

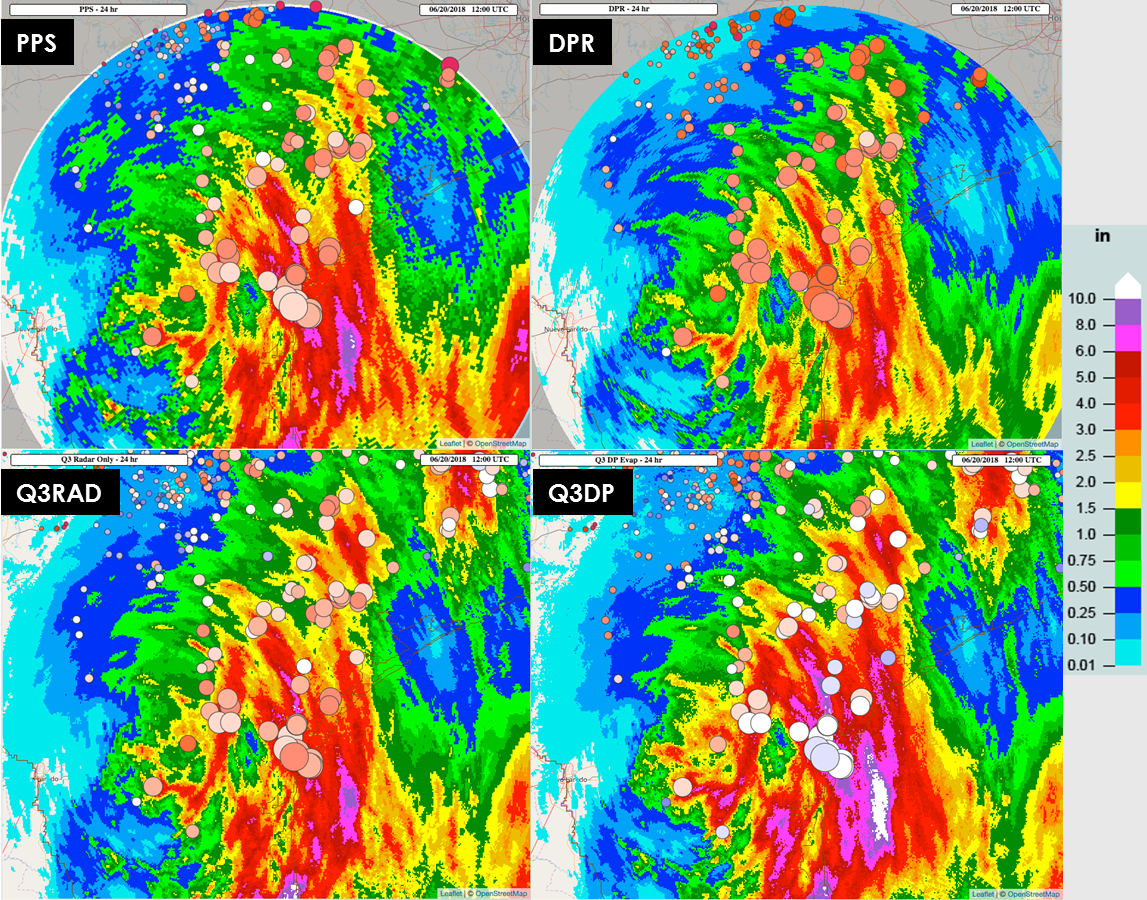
Events like these will undergo detailed analysis by the NSSL and CIMMS researchers in the MRMS group to determine the performance of multiple QPE sources and how MRMS can improved upon existing platforms. The focus of the evaluation shown here is within a 230 km range of the Corpus Christi, TX NEXRAD radar (KCRP) ending 1200 UTC 20 June 2018. The bubble plot shown below compares the daily gauge observations versus 24-hour accumulations of the Z-only (PPS) and dual-pol (DPR) single radar accumulations along with the operational Z-only MRMS radar-only QPE (Q3RAD) and the experimental MRMS dual-pol radar QPE (Q3DP) with evaporation correction. Warmer colors of the gauge bubble plots indicate an underestimation of the QPE product at that point, cooler colors indicate an overestimation of the QPE, and white mean the gauge and QPE are well correlated.

24-hour accumulation of various single radar and MRMS QPE products versus gauge observations ending 1200 UTC 20 June 2018.

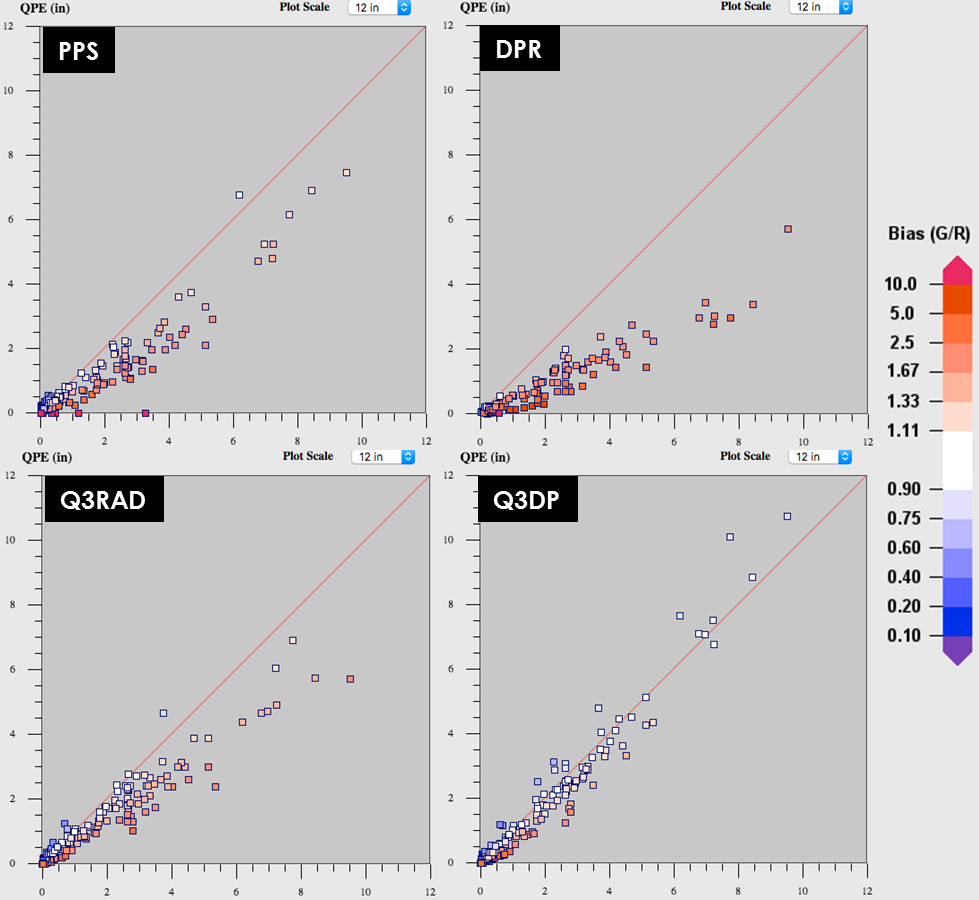
A statistical analysis of the various QPE sources characterized how the operational MRMS Q3RAD product showed some improvement over the two single-radar QPE accumulations; however, it still produced an underestimation bias, especially with rainfall accumulations exceeding 2-3 inches. The experimental MRMS dual-pol QPE (Q3DP) and its incorporation of various dual-polarization fields provided a much better depiction of the QPE across all accumulation ranges, especially the higher-end totals, while the evaporation correction algorithm reduced some of the overestimation bias seen with the lighter totals on the outer edge of the precipitation area.

Scatter-plot of gauges versus radar-based QPE values for all 24-hour observations within 230 km of KCRP ending 1200 UTC 20 June 2018.

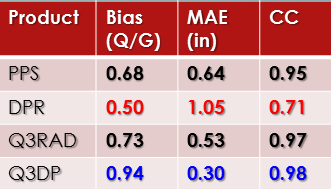
The table below shows the average mean bias ratio (QPE over gauge), mean absolute error (MAE; in inches), and the correlation coefficient (CC) for the associated scatter plots. It clearly shows that the experimental MRMS Q3DP QPE with evaporation correction clearly outperformed the rest of the operational single-radar and MRMS QPE products.

Statistical results of the QPE analysis shown in the scatter plots above.

We will continue to evaluate cases and the overall performance of our latest QPE algorithms. The MRMS dual-pol QPE with evaporation correction will become operational in the MRMS v12.0 build, currently scheduled for January 2019.

Tags: None

The Ellicott City, MD Flash Flood Event

Less than two years removed from the devastating flash floods that impacted Ellicott City, MD in 2016, the same area experienced another catastrophic flash flood on Sunday, May 27th. The work conducted by NSSL scientists with the recently updated Multi-Radar Multi-Sensor (MRMS) system along with the hydrologic modeling from the Flooded Locations and Simulated Hydrographs (FLASH) project was put to the test during this event.

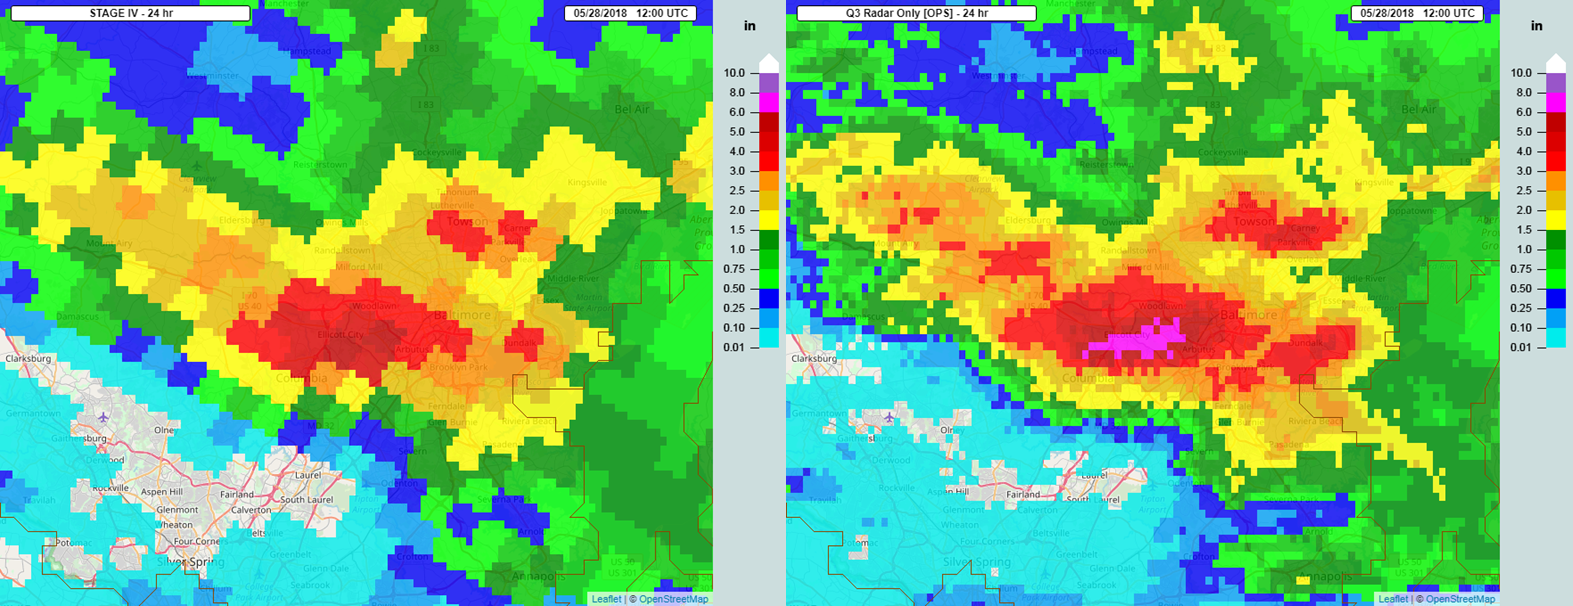
One of the key benefits of quantitative precipitation estimations (QPEs) from the MRMS system is the high spatio-temporal resolution of the products. The comparison of the operational MRMS radar-only QPE product at the 1-km Cartesian grid space versus QPE generated at a coarser 4-km polar stereographic  grid space displays the ability for MRMS to capture the greater precipitation totals because of its finer resolution.

Comparison of 4-km resolution QPE versus 1-km resolution MRMS QPE. Shown are 24-h accumulations ending at 1200 UTC 28 May 2018.

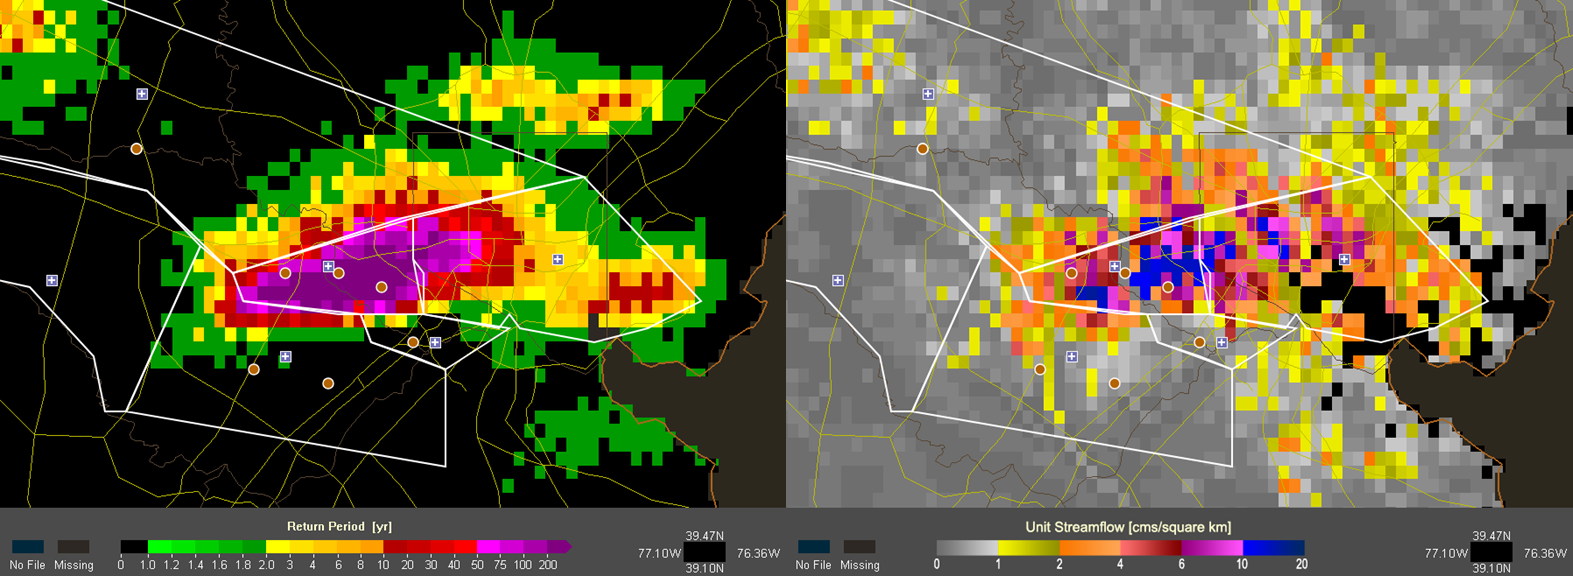
Using the 1-km resolution MRMS QPE, the FLASH system performs QPE comparisons and runs hydrologic models to determine areas that could experience flash flooding and their potential severity. The rainfall shown exceeded the 200 year return period color scale and was likely a 1000 year return period. The unit streamflow map highlights the areas of the flash flood threat. The blue colors representing unit streamflow values exceeding 10 cms/square km are generally correlated with major flash flooding and “Flash Flood Emergency” events.

QPE maximum average recurrence interval and CREST hydrologic model unit streamflow at 2200 UTC 28 May 2018. The white polygons represent flash flood warning and the brown dots represent flash flood reports.

NSSL scientists will analyze this particular case and other flash flood events to continue improving upon the research and algorithms that drive the MRMS and FLASH systems. While events like these are tragic for those impacted by the power of flood water, the findings and continued research will allow for even better products to assist forecasters with flash flood prediction and their operational warning decisions.

Operational MRMS Product Viewer: https://mrms.nssl.noaa.gov/

FLASH Product Page: http://flash.ou.edu/

Tags: None

MRMS Version 11.5 is Operational in NWS

On 17 May 2018, MRMS Version 11.5 became operational in the National Weather Service (NWS). This build contains a number of updates that impact the generation and delivery of MRMS QPE products. These changes include the ability to handle new volume coverage patterns from the NWS fleet of WSR-88D radars, new radar quality index logic, more hourly gauges, and reduced product latency.

The next version of MRMS (v12.0) is tentatively scheduled to become operational in January 2019. More details will be provided soon on MRMS v12.0, which contains the biggest advancements in the generation of QPE in MRMS since the initial operational release back in 2014. Stay tuned…

Tags: None

Completing the Operations to Research Cycle

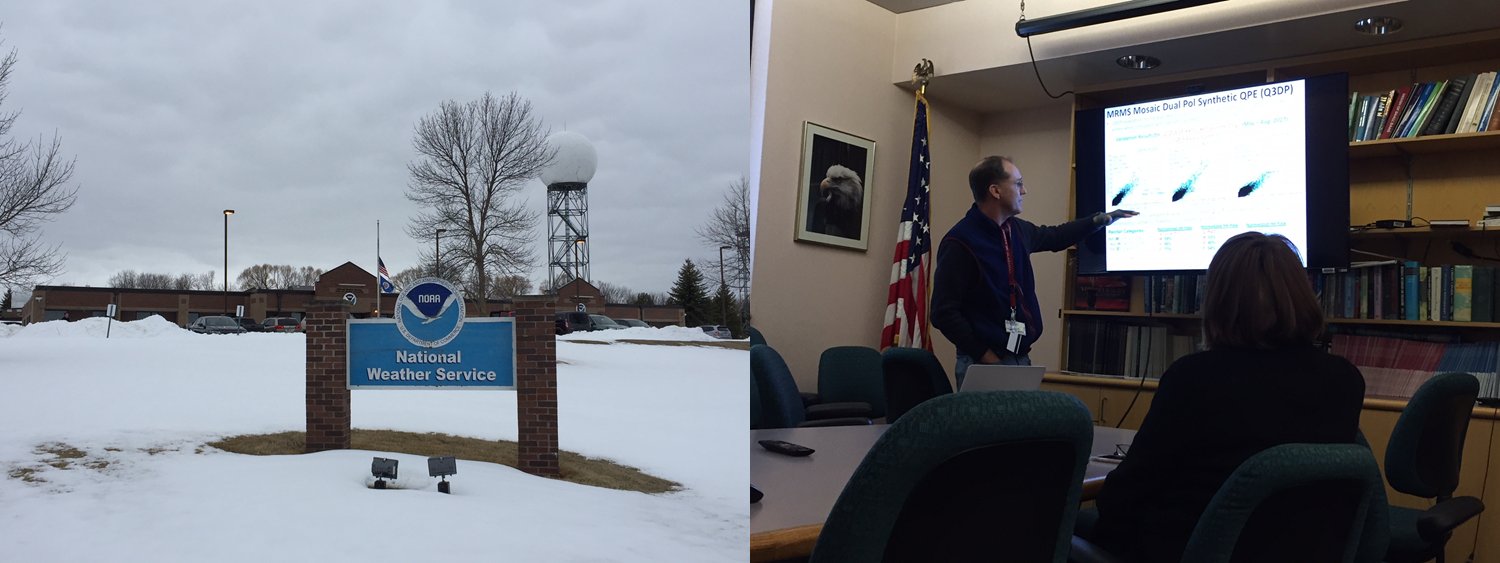
As part of the efforts to improve MRMS precipitation estimations, NSSL scientists with the MRMS group visit National Weather Service (NWS) River Forecast Centers (RFCs) to discuss ongoing challenges with estimating precipitation. The month of April consisted of trips to the North Central RFC in Chanhassen, MN and the West Gulf RFC in Fort Worth, TX. Specific topics included the following:

  • The current performance of the MRMS QPE product suite,
  • Shadowing forecaster shifts to better understand the use of QPE products in developing the NWS Multisensor Precipitation Estimator (MPE) product,
  • Upgrades to the MRMS system for both v11.5 and v12.0, and
  • Future work regarding the next steps in improving precipitation estimation for the NWS.

The ongoing collaboration between NSSL and the NWS RFCs have yielded valuable insight into the challenges that operational forecasters have with precipitation estimation. This has allowed for MRMS scientists to develop new products and techniques, which in turn helps the forecasters create better products for their users. More site visits will follow over the next several months.

Tags: None

Collaboration with Taiwan on QPE and Hydrology

Members from Taiwan’s Central Weather Bureau and Soil and Water Conservation Bureau met with NSSL researchers in March and April to collaborate on  precipitation estimation and hydrology. Collaboration between NSSL scientists and Taiwan meteorologists began over 16 years ago with the development of a MRMS domain over Taiwan.

More information about this collaboration can be found here:

https://inside.nssl.noaa.gov/nsslnews/2018/03/collaboration-with-taiwanese-agency-foundational-to-nssls-mrms-system/

Tags: None