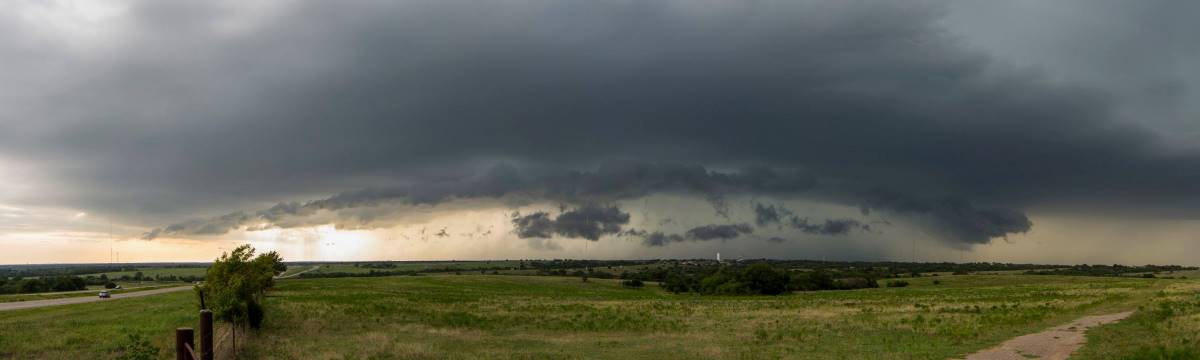
Only two years after the historic rainfall from Hurricane Harvey, the nearly stationary movement from the remnants of Tropical Storm Imelda produced another catastrophic flood event over southeast Texas. Convective features being fed by an unstable atmospheric environment and the warm waters of the Gulf of Mexico produced rain rates of 4-6 inches per hour. Localized rainfall accumulations of over three feet were recorded. Most of this rainfall fell within a 24-hour period.
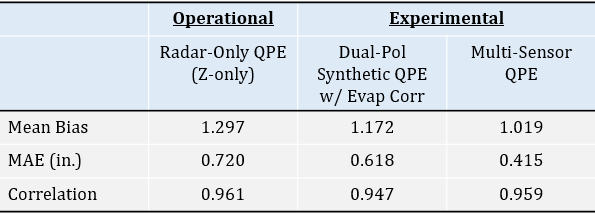
The experimental version of MRMS, designated as MRMS v12.0, produced a considerably accurate depiction of the rainfall over southeast Texas (Table 1). Analysis shown below is focused on the 24-hour period ending 1200 UTC 19 September 2019. The MRMS QPEs were compared against independent CoCoRaHS observations. The operational version of the MRMS radar-only QPE that is based only on reflectivity had some general overestimation bias for the period of greatest rainfall. The MRMS v12.0 dual-pol synthetic radar QPE with evaporation correction produced greater totals between Beaumont and Winnie, TX, but had overall better statistical values with some overestimation bias. The maximum 24-h value shown with the experimental dual-pol synthetic QPE product was 36.62 inches.
The experimental MRMS dual-pol synthetic radar QPE with evaporation correction is fed into the next update for the Flooded Locations and Simulated Hydrographs (FLASH) system, which is available at http://flash.ou.edu/. The extreme rainfall rates and accumulations created off-the-chart values for the CREST maximum unit streamflow values (Figure 1); yet, the over 1000 water rescues, countless road closures, and numerous evacuations justify the extreme hydrologic values.

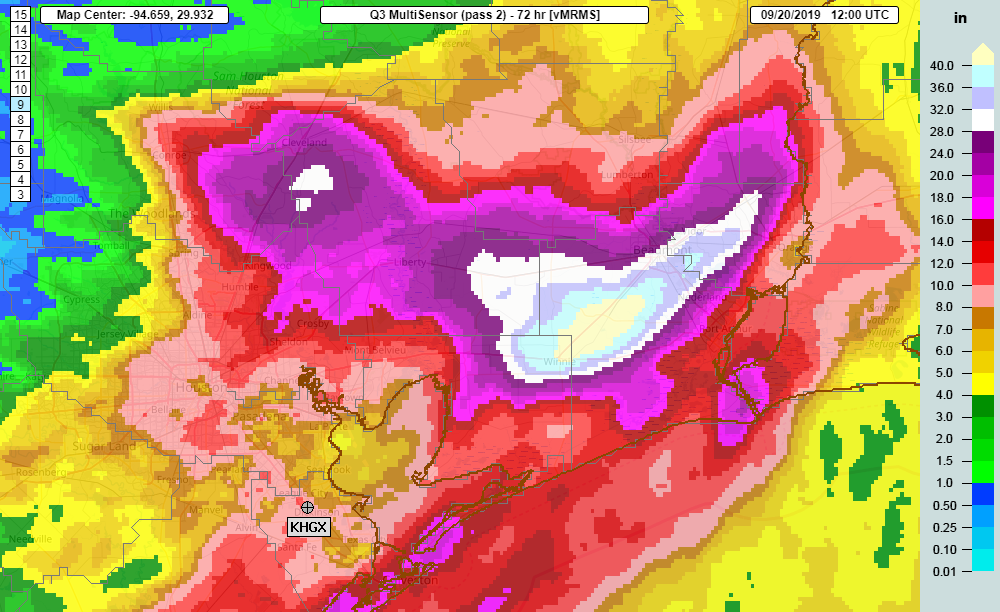
The MRMS v12.0 Multi-Sensor QPE, which gauge-corrects the radar data while gap-filling radar coverage, had a near-perfect bias at 1.018 with lower statistical errors. The maximum 24-h value over the period ending 1200 UTC 19 September 2019 was 34.10 inches. The overall 72-h total from the period ending 1200 UTC 20 September 2019 using the MRMS v12.0 Multi-Sensor QPE is shown in Figure 2. There is a significant area of 18+ inches of rainfall stretching from near The Woodlands to the Texas/Louisiana border. Over three feet of rain fell from west of Winnie, TX to Beaumont, TX. The maximum three-day total from the experimental MRMS Multi-Sensor QPE was 45.70 inches.
The experimental MRMS v12.0 product suite will be operationally implemented in the National Weather Service in Q4 of FY20; however, local NWS office can pull the MRMS v12.0 data from their regional headquarters for testing and evaluation. The experimental MRMS v12.0 data can also be viewed on the web at https://mrms.nssl.noaa.gov/qvs/mrms_v12/index.php.