The week of June 18, 2018 had series of high-impact flash flood events across the United States. One of the more prominent events occurred in southern Texas as a result of a nearly stationary tropical wave that moved in from the western Gulf of Mexico.
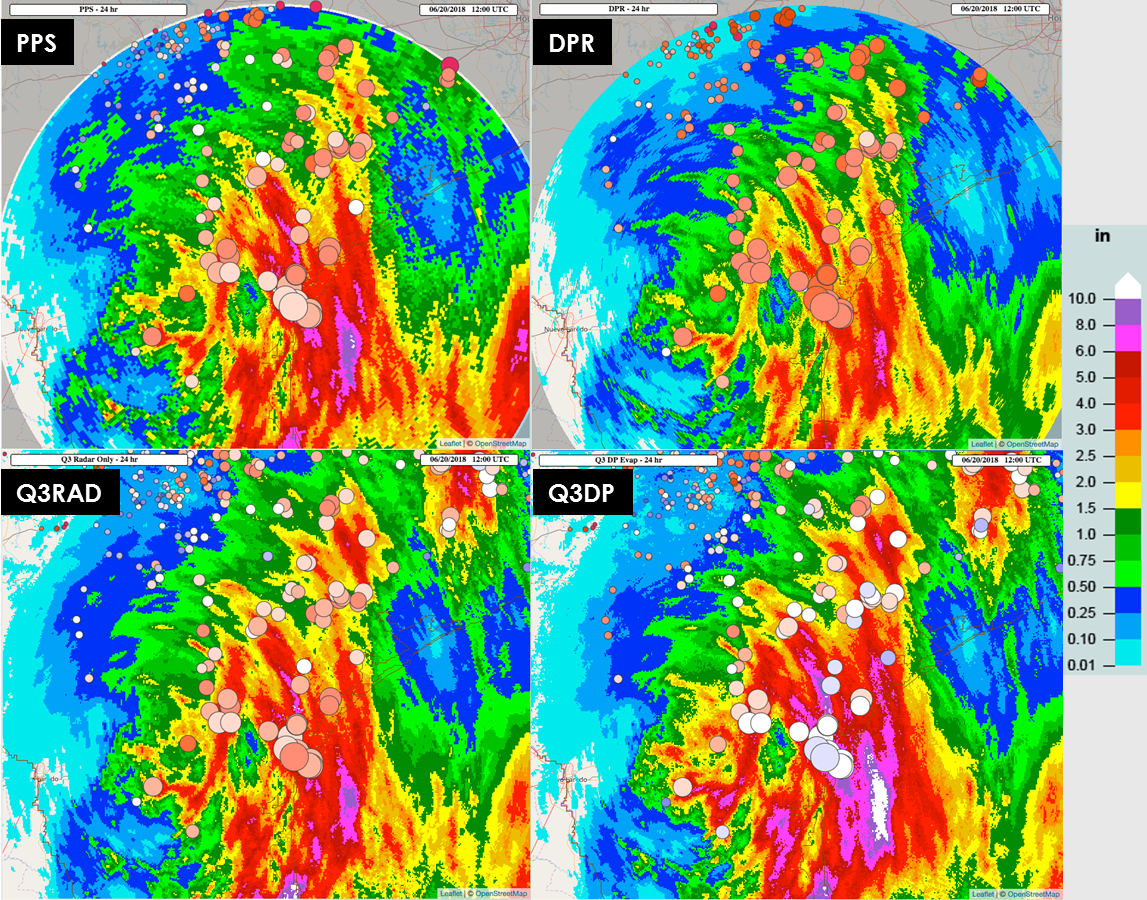
Events like these will undergo detailed analysis by the NSSL and CIMMS researchers in the MRMS group to determine the performance of multiple QPE sources and how MRMS can improved upon existing platforms. The focus of the evaluation shown here is within a 230 km range of the Corpus Christi, TX NEXRAD radar (KCRP) ending 1200 UTC 20 June 2018. The bubble plot shown below compares the daily gauge observations versus 24-hour accumulations of the Z-only (PPS) and dual-pol (DPR) single radar accumulations along with the operational Z-only MRMS radar-only QPE (Q3RAD) and the experimental MRMS dual-pol radar QPE (Q3DP) with evaporation correction. Warmer colors of the gauge bubble plots indicate an underestimation of the QPE product at that point, cooler colors indicate an overestimation of the QPE, and white mean the gauge and QPE are well correlated.
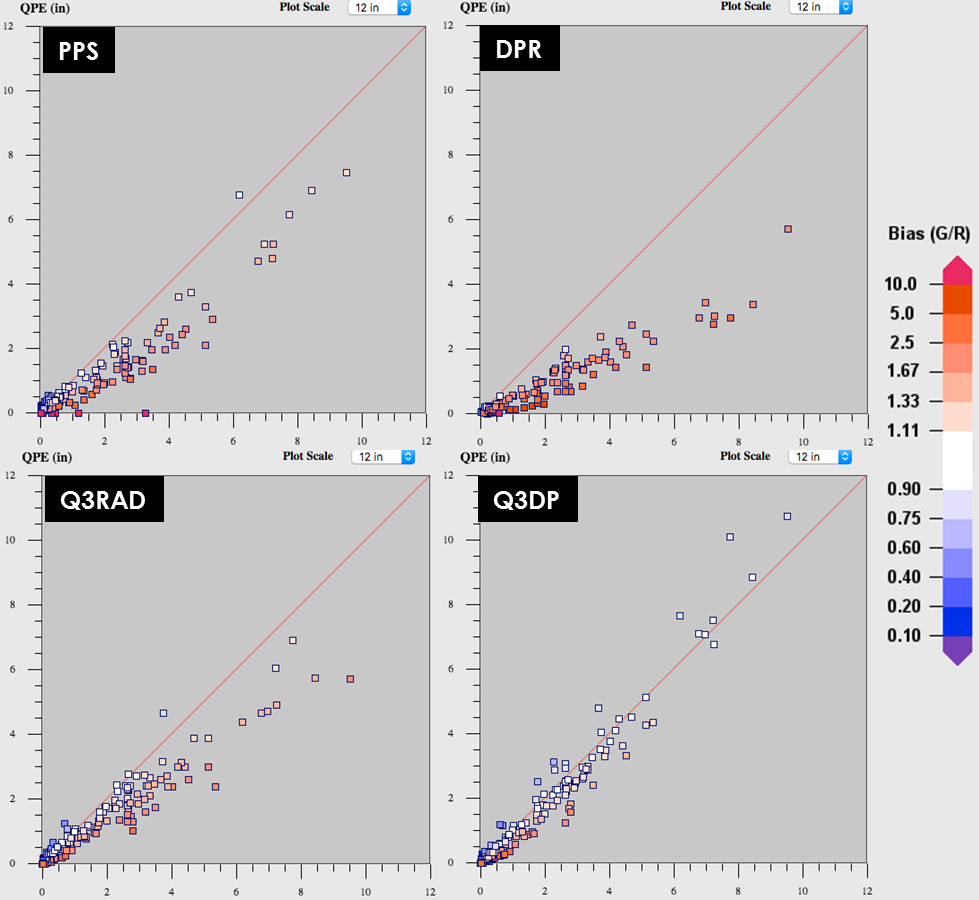
A statistical analysis of the various QPE sources characterized how the operational MRMS Q3RAD product showed some improvement over the two single-radar QPE accumulations; however, it still produced an underestimation bias, especially with rainfall accumulations exceeding 2-3 inches. The experimental MRMS dual-pol QPE (Q3DP) and its incorporation of various dual-polarization fields provided a much better depiction of the QPE across all accumulation ranges, especially the higher-end totals, while the evaporation correction algorithm reduced some of the overestimation bias seen with the lighter totals on the outer edge of the precipitation area.
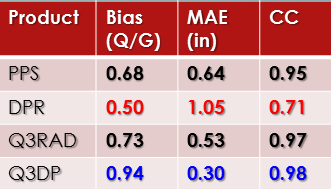
The table below shows the average mean bias ratio (QPE over gauge), mean absolute error (MAE; in inches), and the correlation coefficient (CC) for the associated scatter plots. It clearly shows that the experimental MRMS Q3DP QPE with evaporation correction clearly outperformed the rest of the operational single-radar and MRMS QPE products.
We will continue to evaluate cases and the overall performance of our latest QPE algorithms. The MRMS dual-pol QPE with evaporation correction will become operational in the MRMS v12.0 build, currently scheduled for January 2019.