THREATS-IN-MOTION

THREATS-IN-MOTION (TIM)

Summary

Why Threats-In-Motion (TIM)?

TIM is a warning generation approach that would enable the NWS to advance severe thunderstorm and tornado warnings from the current static polygon system to continuously updating polygons that move forward with a storm.  This concept is proposed as a first stage for implementation of the Forecasting a Continuum of Environmental Threats (FACETs) paradigm for severe weather warnings.  A simple change in the way warnings are generated can achieve major improvements.

What is FACETs?

Forecasting A Continuum of Environmental Threats (FACETs) is a next-generation forecast and warning framework that is modern, flexible, and designed to communicate clear and simple hazardous weather information to serve the public, extending from days to within minutes of an event for all environmental threats.  FACETs-Severe is focused on severe convective weather, such as tornadoes, thunderstorm winds, hail, and lightning.
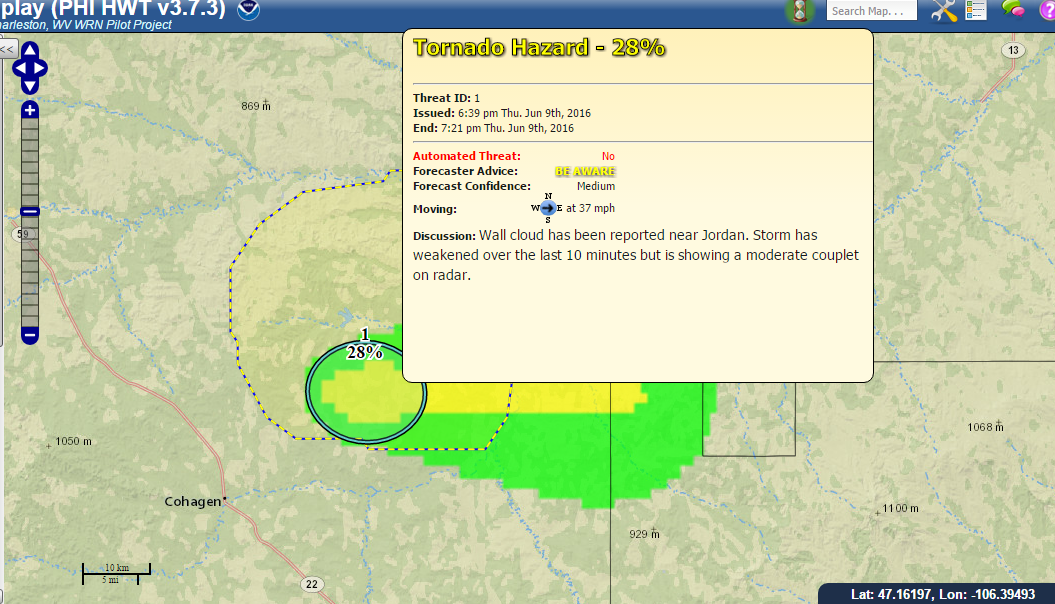
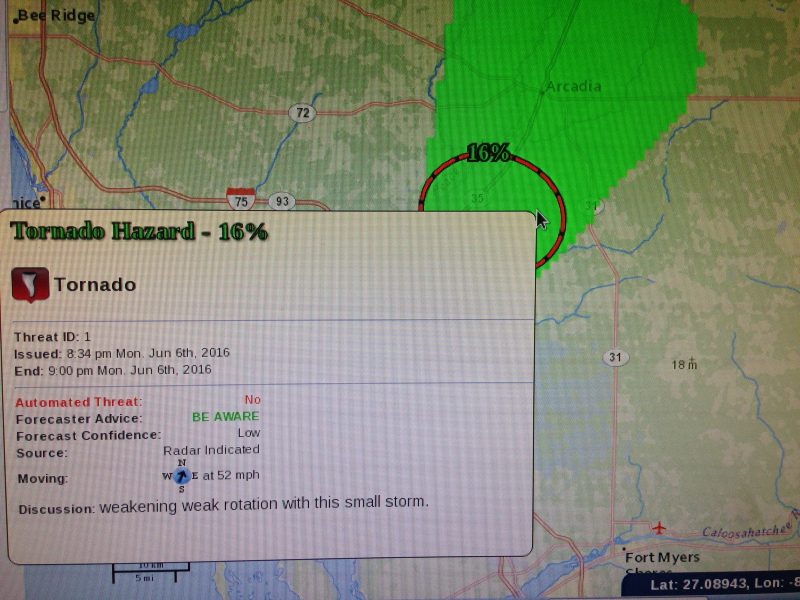
What is PHI?

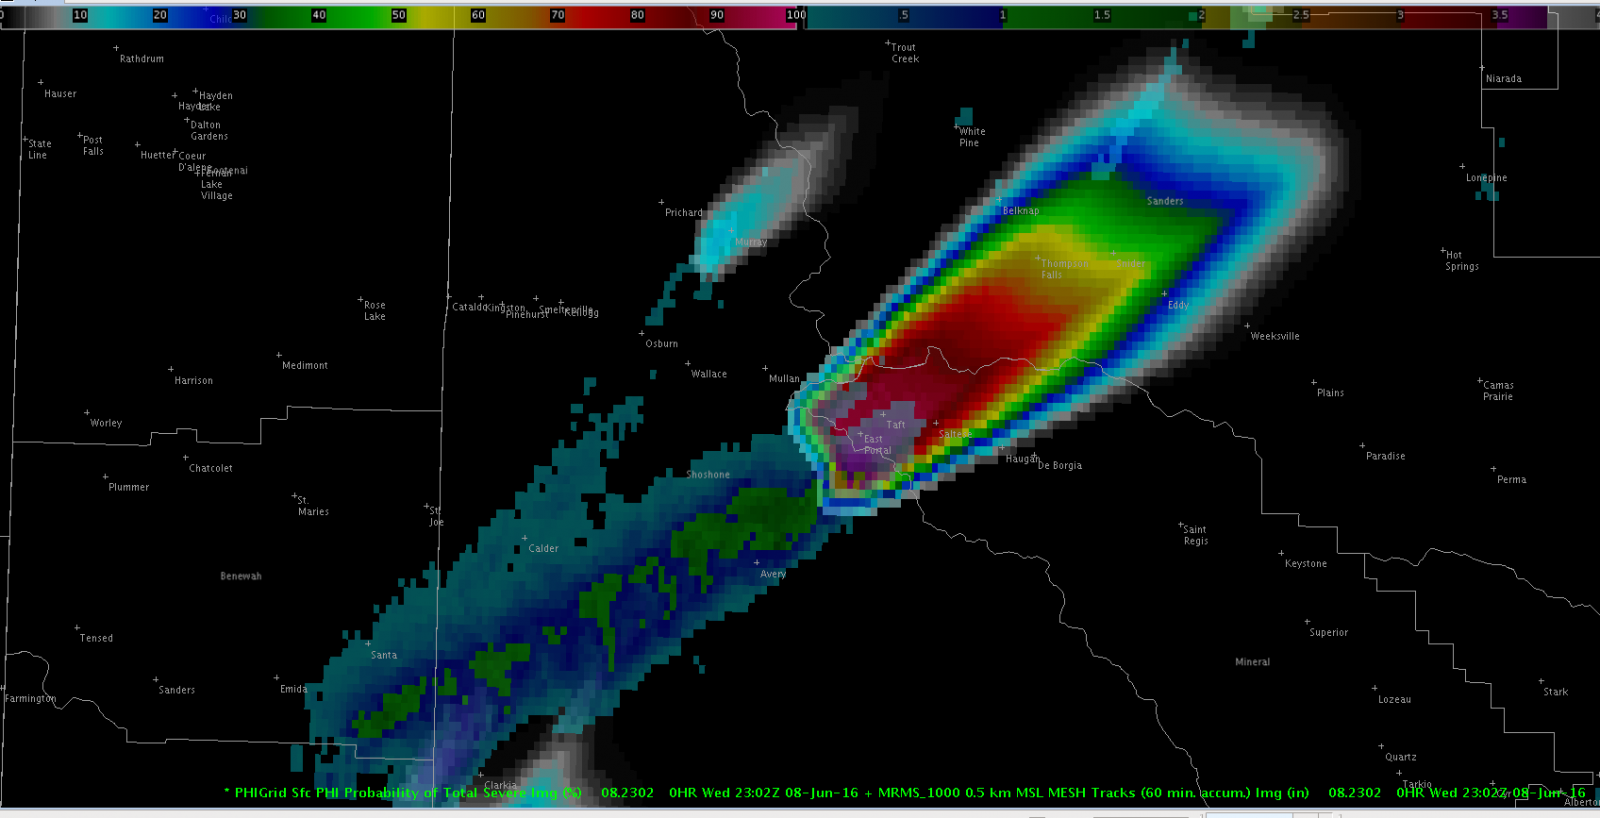
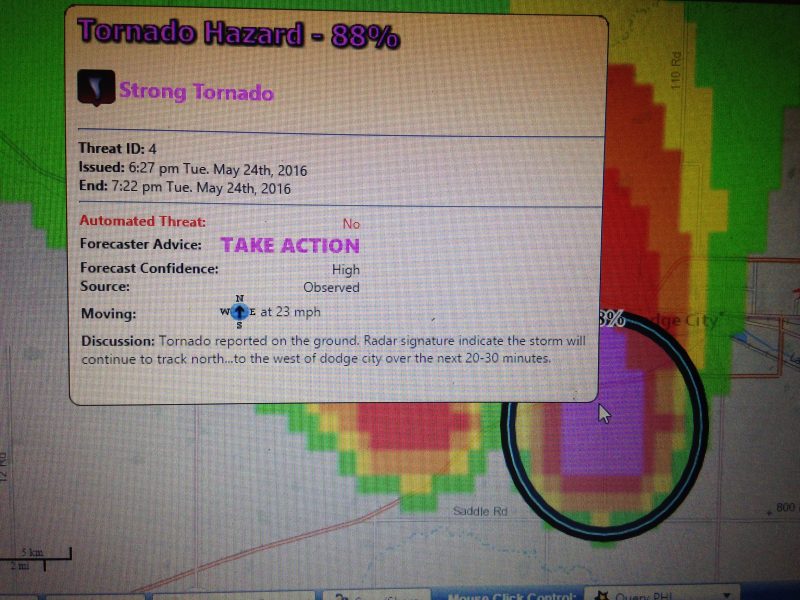
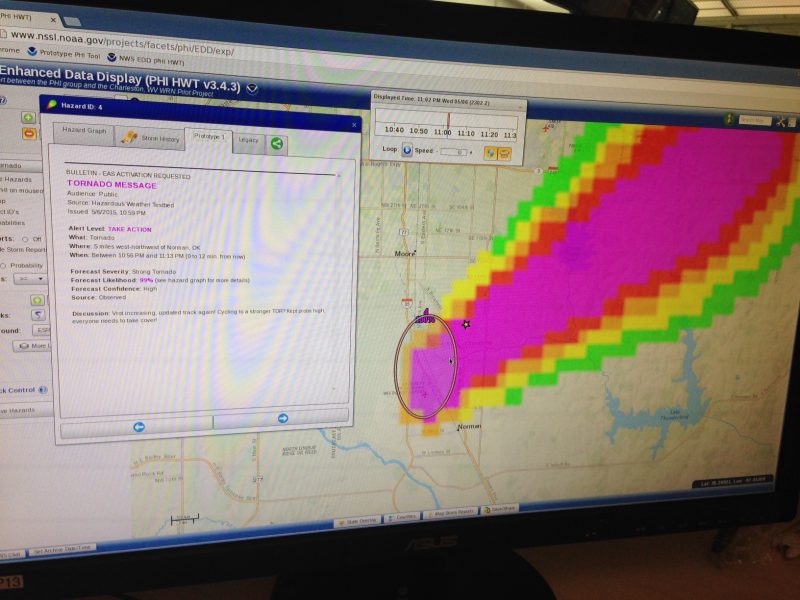
Probabilistic Hazard Information (PHI) are continuously-updating probabilistic hazard grids (Fig. 1).  PHI can be used to provide custom user-specific products that can be tailored to adapt to a variety of needs – for example, providing longer lead times, at lower confidence, for more vulnerable populations with a lower tolerance for risk.

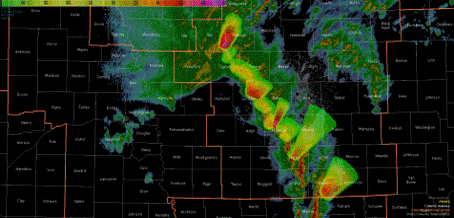
Figure 1.  Top:  a continuously-updating Probabilistic Hazard Information (PHI) plume; Bottom: AWIPS2 Hazard-Services-Probabilistic Hazard Information (HS-PHI) showing multiple hazard plumes.

What are Threats-In-Motion?

TIM are NWS Severe Thunderstorm Warnings and Tornado Warnings represented by continuously-updating warning polygons.  TIM polygons update every minute, and march forward with the storm threat.  TIM is essentially PHI, but without the probabilities (which will come later as the science evolves).

Why continuous updates?

Because weather is continuously updating!  Data used for severe weather forecast and warning decision making is updating continuously, ranging from radar, satellite, lightning, near-storm environment, as well as guidance algorithm data such as Multiple-Radar/Multiple-Sensor (MRMS) and ProbSevere – each which update at 1- to 2-minute intervals.

What are the disadvantages of the current warning system?

Currently, when NWS forecasters issue warnings for long-lasting severe thunderstorms, the storms are handled by a series of separate warning polygons that are issued one after the other, often with little overlap, as a storm moves along a path (Fig. 2).  This frequently results in non-uniform lead times for those who are on the border of a severe thunderstorm or tornado warning.  Nearly adjacent locations can have dramatically different lead times if one location is just outside the upstream warning.  With each subsequent warning in the series, this behavior continues.  This is particularly noticeable for long-track tornado events (Fig. 3).  In some cases, the workload of the forecaster is too great to keep up with the issuance of new downstream warnings, and sometimes a storm can move out of a current polygon and become unwarned.Figure 2.  Present day warning paradigm:  Idealized event with a moving storm threat (circle) and two separate Severe Thunderstorm Warnings issued 55 minutes apart.  Two users, A and B, received inequitable lead time.


Figure 3.  Actual NWS tornado warning polygons (yellow) for the storm that impacted Lee County, AL, on 3 March 2019.

What are the advantages of TIM?

With TIM, a warning polygon is attached to the threat and moves forward along with it (Fig. 4, Fig. 5).  This provides equitable lead time for all locations downstream of the event (Fig. 6).  When forecaster workload is high, storms remain continually tracked and warned.  In addition, TIM can also support the capability to provide automated “all clear” information when the threat has passed [1].  TIM is more temporally-specific, and provides meaningful information about times of arrival and departure [2].  This all results in greater average lead times and lower average departure times than our current warnings, with little to no impact to average false alarm time (Fig. 7).
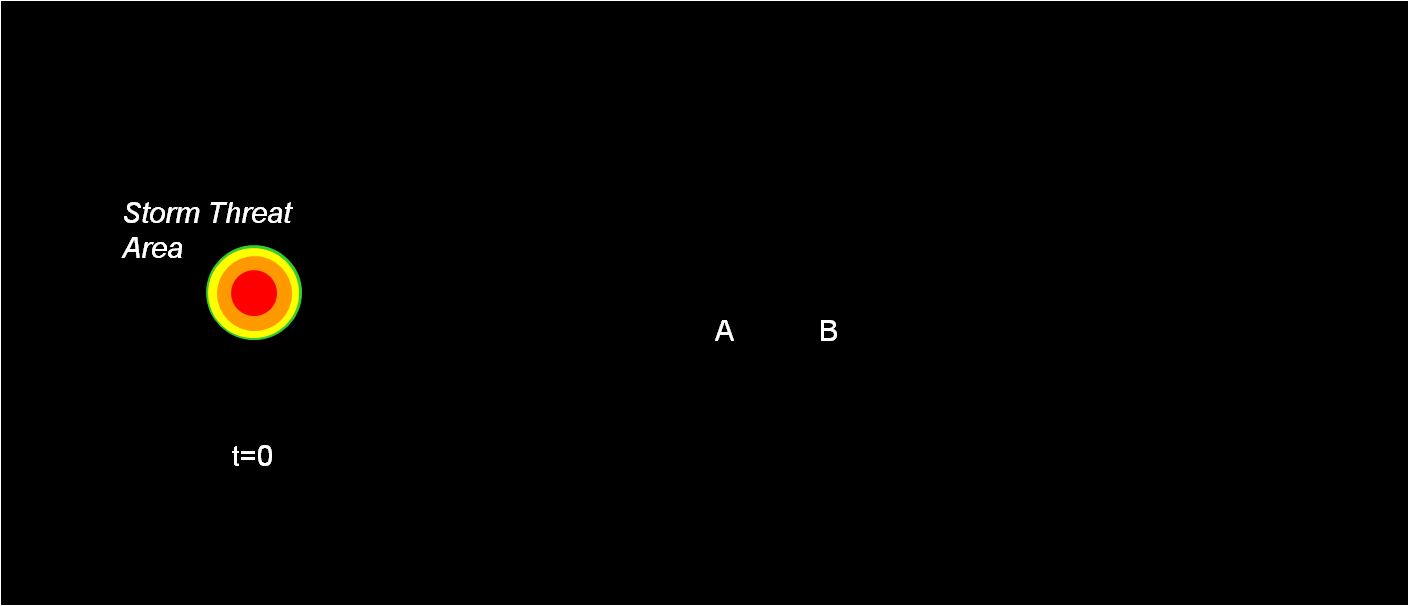
Figure 4.  Threats-In-Motion (TIM) warning paradigm:  Idealized event with a moving storm threat (circle) and one single Severe Thunderstorm Warning continuously moving with the threat.  Two users, A and B, received equitable lead time.

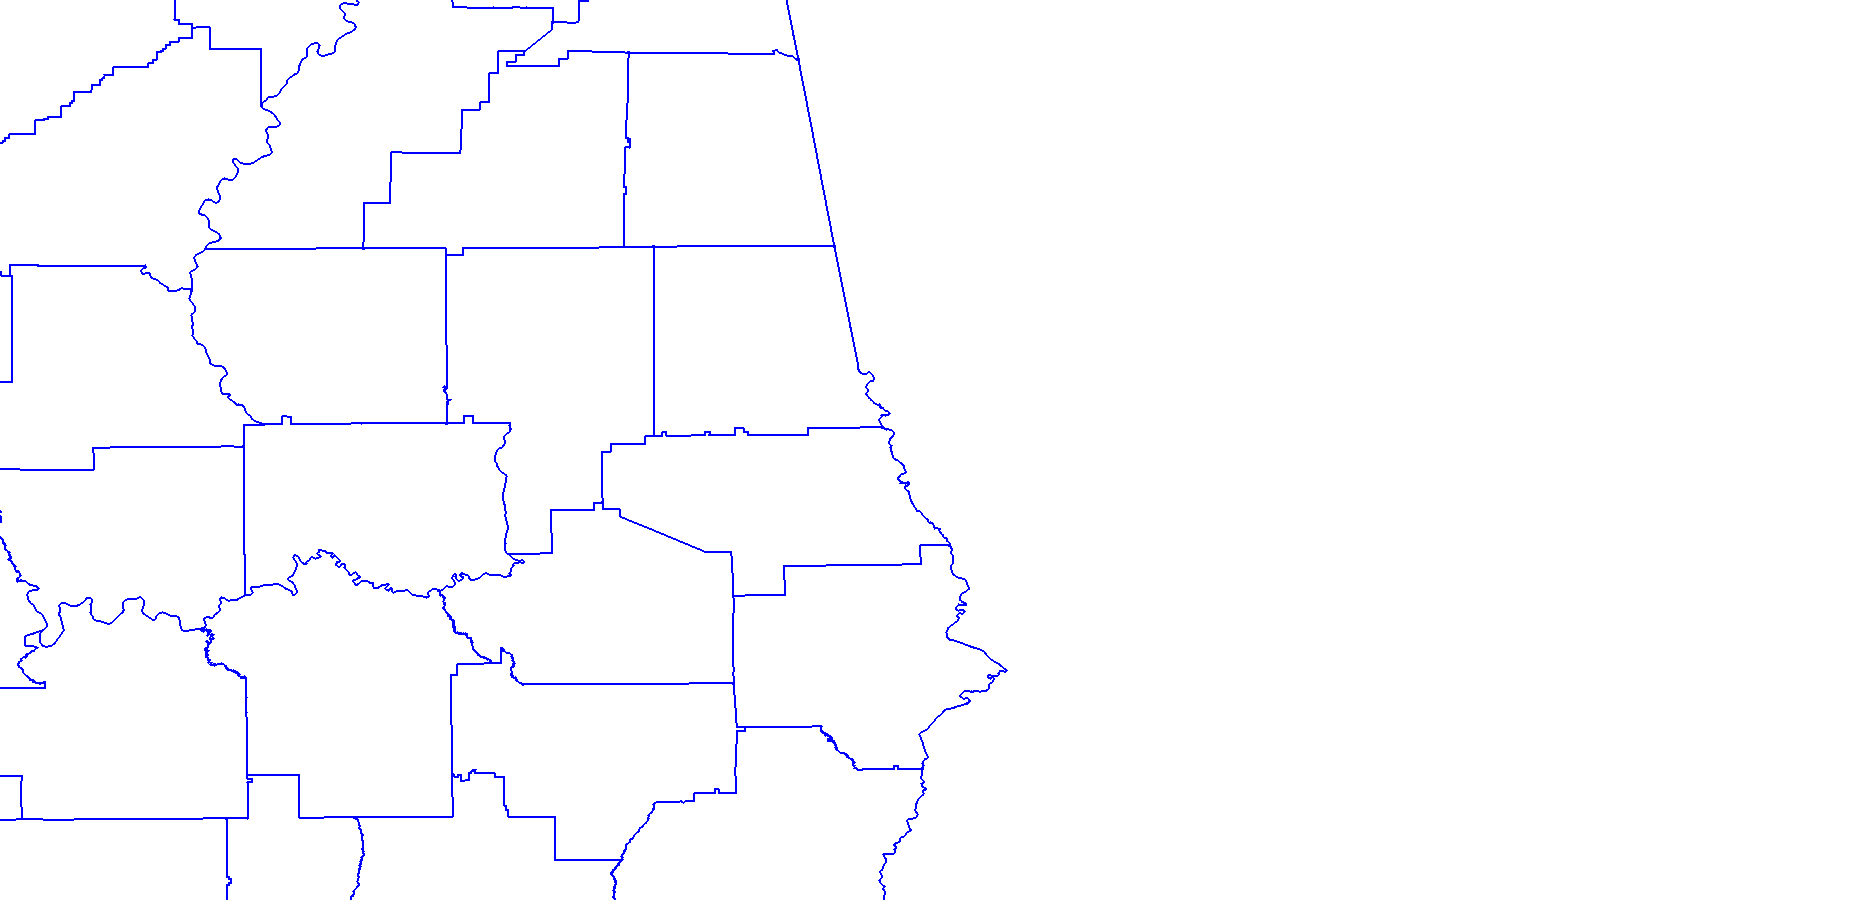
Figure 5.  Threats-In-Motion (TIM) warning polygons (gray) for the storm that impacted Lee County, AL, on 3 March 2019.​​​​​

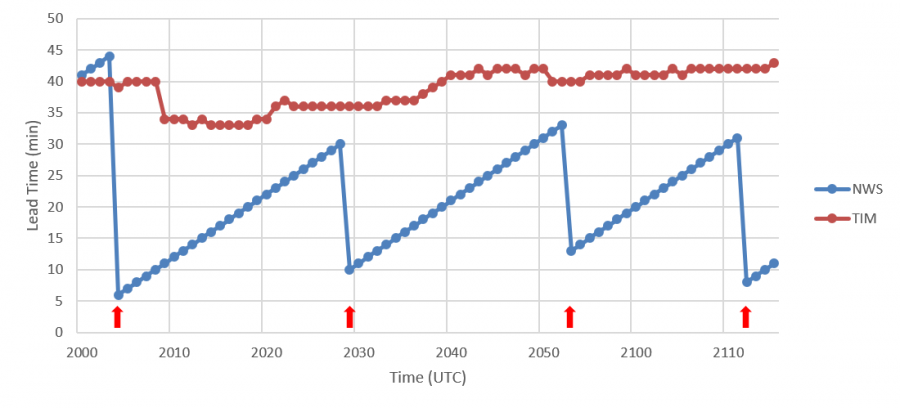
Figure 6.  Timeline of one-minute tornado segment lead times (min) for the Lee County, AL, tornado on 3 March 2019.  The red arrows indicate locations where new NWS warnings became effective for that portion of the tornado track.  NWS warning lead time (blue) shows discontinuities along path, with some locations receiving much less lead time than others.  Threats-In-Motion (TIM) warning lead time (red) shows equitable, and greater lead time for the entire tornado.  Times are UTC.

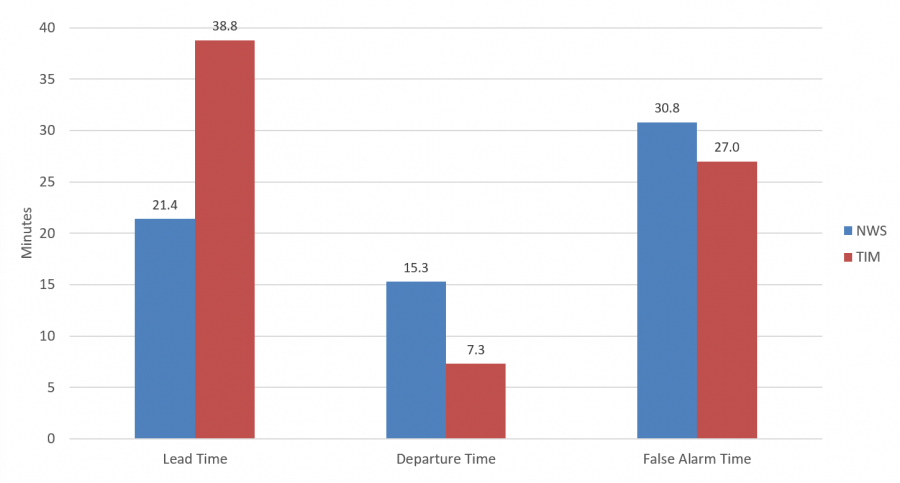
Figure 7.  Average lead time, average departure time, and average false alarm time for all one-minute tornado segments for the Lee County, AL, tornado on 3 March 2019.  Units are minutes.

Why not just increase the duration of our current warnings?

Because this will greatly increase average false alarm area and false alarm time at the expense of the greater lead time.  Also, locations within the warning will still have inequitable lead times.

TIM isn’t just for severe thunderstorm and tornado warnings.

The Storm Prediction Center is already developing Watches-In-Motion and outlooks in motion for severe convective threats.  TIM is intended to span the entire time and space scales of severe weather.

How will TIM work with the warning forecaster?

TIM is already designed for AWIPS2 Hazard Services, which has already been tested during Fall 2019 and Winter 2020 at the​​​​​ NOAA Hazardous Weather Testbed.  Forecasters define 2D storm objects and determine their motion vectors, and the polygon swaths are derived from that information.  2D object-based storm analysis improves location and motion estimates versus the point or line tracking in WarnGen.  If the storm is expected to live beyond the typical warning duration, the forecaster turns on the Persist option.  As with today’s warning best practices for intermediate warning updates (known as Severe Weather Statements), the forecaster intervenes with the object every 15 minutes or so to modify the object shape, location, duration, motion information, and warning details.  If the shape or motion of a storm changes, TIM allows for adjustments to the polygon without having to wait for warning to end, or issuing another potentially-confusing warning.  The same storm could be depicted using the same ID throughout, along with a continuous history of the storm’s evolution.  When the forecaster feels the storm is nearing the end of its life-cycle, they will turn the Persist option off and let the warning naturally expire.

What about short-lived storms?

For short-lived storms, like pulse-severe storms, the best practice is to not persist the warnings.  But even for non-persisting warnings, the trailing end of a TIM warning is always updating and automatically clearing out places where the hazard has already passed.

Challenges.

How would a rapidly-updating warning product work with the various warning dissemination technologies available, such as county-based systems (e.g., NOAA Weather Radio), and location-based systems (WEA mobile alerts)?  We have some ideas, but need to work with experts in dissemination in both the public and private sector before we can determine if there is viability in moving forward with the TIM paradigm.

In summary:

  • Lead times are equitable for all locations.
  • Average lead times are increased.
  • Average departure time is reduced.
  • Minimal impacts to average false alarm time.

The bottom line…

Threats-in-motion offers improvements to the current warning paradigm, especially for storms expected to live longer than your average warning duration such as the long-tracked supercells we see on violent tornado outbreaks, when it matters most.


FOR MORE INFORMATION:

Bite-Sized Science: Threats in Motion (NSSL Video)

Stumpf, G. J., and A. E. Gerard, 2021:  National Weather Service severe weather warnings as Threats-in-Motion (TIM).  Wea. Forecasting, 36, early online release.  https://doi.org/10.1175/WAF-D-20-0159.1


FOOTNOTES:

From Laura Myers’ study, “Collaborative Research: Understanding How Uncertainty in Severe Weather Information Affects Decisions-Results from Alabama Residents and the Local Weather Enterprise”:

[1] A significant element missing in messaging appears to be the “all clear” indicator. The public perceives there is minimal information provided regarding when the danger has passed. They may come out of their shelters too soon or they may stay too long in their shelters and become agitated because they do not know when they will be safe.

[2] This research has indicated that location and timing are probably two of the most critical elements in the messaging process.  Location is critical because people do not want to change their behavior unless required. Timing is also a critical issue for the public because they want to know when they should prepare to take action.

rev. 3/8/2021

PHI out west

As the final week of the PHI Prototype experiment wrapped up, the weather pattern become favorable for active severe weather over the northern Rockies/Plains regions.  This enabled our project to center real time operations over parts of northern Idaho and Montana, focusing on the WFO Missoula area on Wednesday and the WFO Glasgow area on Thursday. Wednesday evening’s primary severe weather threat was large hail, and hence forecaster and the EM/media groups focused on producing and using PHI for severe storms and lightning.  Along with using product streams like MRMS, a key tool PHI HWT forecasters utilize in analysis and producing PHI is CIMSS ProbSevere.  ProbSevere provides the initial probabilistic values for severe weather and lightning for storm objects – forecasters can then adjust the algorithm values when creating their PHI plumes.

AWIPS 2 display of MRMS Maximum Estimated Hail Size swath overlaid with PHI plume forecasts of probability of severe thunderstorms.
AWIPS 2 display of MRMS Maximum Estimated Hail Size swath overlaid with PHI plume forecasts of probability of severe thunderstorms, focused on a severe storm near Taft, MT.

On Thursday evening, supercells moved across parts of central and eastern Montana producing damaging winds and large hail.  While conditions were not overly favorable for tornadoes, one particular supercell near Jordan, MT had a persistent wall cloud along with some reports of funnel clouds.  Along with monitoring the typical severe weather data, HWT forecasters also were able to see realtime video and pictures from storm chasers in the region.  This data was utilized to produce PHI for tornado potential, with most of the PHI objects giving information about lower probabilities than might typically be associated with tornado warning situations.  The forecaster and EM/media groups then discussed how this probabilistic information might be utilized to help improve decision making and provision of severe weather information for the public.

PHI plume for tornado probability for a supercell storm near Jordan, MT. The text in the pop-up window is a potential text product based on NWS Hazard Simplification project prototypes. The yellow outlined box is the representation of a legacy severe thunderstorm warning derived from severe thunderstorm PHI data.
PHI plume for tornado probability for a supercell storm southeast of Jordan, MT. The text in the pop-up window is a potential text product based on NWS Hazard Simplification project prototypes. The yellow outlined box is the representation of a legacy severe thunderstorm warning derived from severe thunderstorm PHI data.


Tags: None

PHI in the tropics

On the first day of the third and final week of the PHI Prototype Experiment, Tropical Storm Colin was impacting Florida during the afternoon hours when the initial shakeout operational session was underway.  Hence, this region was selected as the operations area for the realtime period of operations.  Forecasters generated probabilistic hazard guidance for potential tornadoes, damaging winds and lightning with squalls and convective cells moving across Florida in association with Colin.  This included experimenting with producing lower probability tornado forecasts for small supercells which are common with landfalling tropical systems.

PHI plume and associated NWS HazSimp based text for a squall with rotation near Port Charlotte, FL.
PHI plume and associated NWS HazSimp based text for a squall with rotation east of Port Charlotte, FL.

Emergency managers and broadcasters evaluated using the PHI to make decisions about realistic scenarios such as closing schools, cancelling events, etc..  During the end of day debrief, these users discussed potential pros and cons of the PHI paradigm for tropical cyclone situations along with the researchers and NWS forecasters.

End of day debrief after HWT operations for Tropical Storm Colin.


Tags: None

International Participation in HWT

Not only do NWS forecasters and partners from around the United States participate in HWT experiments each spring, but meteorologists from around the globe also travel to Norman to be a part of efforts such as FACETs.  These meteorologists are able to learn about the research going on at NSSL and OU and take that back to their own meteorological services, and also contribute their perspective and expertise based on the natural hazard services and warning systems in their own countries.

During the week of May 13th, two meteorologists from Environment and Climate Change Canada observed and participated in the PHI-Hazards Services Experiment.  These meteorologists work as forecasters at the Meteorological Services Canada Prairie/Arctic Storm Prediction Centre in Winnipeg.  Along with observing the PHI-HS experiment, they also participated in the Storm Prediction Center’s Spring Forecasting Experiment, which includes among its research goals this year projects to examine methodologies to produce higher temporal resolution probabilistic outlooks for severe storms.  The week of May 20th saw Mark Bevan of the UK Met Office participate in the PHI Prototype Experiment.  Mark works as a Met Office Civil Contingencies Advisor, working to provide weather services and decision support to government officials in southwest England.  Mark provided the experiment team with valuable perspective on the warning and hazardous weather support system in the UK, and also gained knowledge about FACETs which hopes to prove useful in developing and improving warning systems for short term weather hazards in the UK.

Mark Bevan from the UK Meteorological Office (foreground) participates with NWS forecasters, broadcasters, emergency managers and researchers in an event debrief during week 2 of the PHI prototype experiment.
Mark Bevan from the UK Met Office (foreground) participates with NWS forecasters, broadcasters, emergency managers and researchers in an end of week debrief at the end of week 2 of the PHI prototype experiment.
Tags: None

PHI and Pulse Storms

For the concept of probabilistic hazard information to be a viable paradigm for providing severe thunderstorm hazard information, it must be able to be robustly produced and utilized for all different modes of storms.  In this year’s PHI Prototype experiment, one of the historical cases being “worked” by the participants is a summer pulse severe storm episode from Georgia.  Below is an example of radar and corresponding PHI guidance produced by a blend of forecaster and algorithm output toward the end of the event.

End of sim close up ATL PHI close_up_ATL_radar and PHI

In addition to the forecasters evaluating the benefits and challenges of the PHI system for these type of pulse events, EMs and broadcasters utilized the NWS EDD to display the data and make decisions about summer type related situations.  For example, EMs utilized lightning and hail/wind PHI to make decisions about potentially evacuating large outdoor venues and adjusting airport operations.  One tool that can be used on the EDD is the ability for the user to display a time series of the PHI probability values for a given storm, along with any reports of severe weather received.

EDD display of time series of probability of severe weather from the ProvSevere algorithm with corresponding reports of severe weather.
EDD display of time series of the PHI probability of severe weather with corresponding reports of severe weather.
Tags: None

PHI Prototype Week 2 off to Busy Start

The second week of the PHI prototype experiment kicked off on Monday, and swung into full gear on Tuesday with an active period of realtime weather.  Evening operations focused on the tornadic supercells affecting the NWS Dodge City service area, and in particular the storm that produced multiple tornadoes in the immediate Dodge City vicinity.

HWT probabilistic hazard plume for tornado to the southwest of Dodge City around 6 pm 24 May.

Emergency managers and our broadcaster were “positioned” in the Dodge City area to perform job related tasks, and evaluate how PHI and associated text products based on the NWS Hazard Simplification project assisted in their decision making.  The mock operations were quite realistic, with emergency managers making decisions about deploying search and rescue teams while additional storms were threatening, and our broadcast team conducting interviews with HWT forecasters about the storms.  HWT forecasters monitored the live feed from our broadcaster, and also live chase footage via the Internet.

IMG_0936
NWS EDD display of text popup window associated with PHI object for tornado just southwest of Dodge City around 6:30 pm.


Tags: None

PHI-HS and Collaboration

IMG_0927
NWS forecaster utilizing AWIPS Hazard Services to generate experimental PHI information for a realtime severe convective event over Florida. Video recorders record operations so that researchers can go back and analyze the forecaster’s actions during the experiment.

This week is the second week of the PHI-HS experiment in the Hazardous Weather Testbed, in which two NWS forecasters are testing and evaluating the production of probabilistic hazard information (PHI) using AWIPS Hazard Services.  One of the important aspects being tested as part of this experiment is how to collaborate the production of PHI across more than one NWS County Warning Area (CWA).  During two of the real time and archived weather events the two NWS forecasters work during the week, each forecaster was assigned a specific area of responsibility.  As storms moved from one area of responsibility to another, the forecasters used NWSChat and Hazard Services to collaborate in an effort to produce consistent, accurate PHI for these storms.   Researchers from NOAA NSSL and GSD, NWS Warning Decision Training Dvision, University of Oklahoma CIMMS, and the University of Akron will evaluate results from the experiment to examine the various technical and procedural issues surrounding effective collaboration.  This testing will not only help examine coordination issues related to PHI production, but could also help provide insight into warning and forecast collaboration issues more generally.

Tags: None

Testing PHI and new messaging

The below picture shows an example of some of the products that emergency managers and broadcasters are evaluating this week for severe weather related decision making.  Each day, NWS forecasters produce these products during two 60 to 90 minute periods – one based on an archived displaced real-time case, and the other a live weather scenario.   Over the last two days, both of the live weather scenarios were in the lower Ohio Valley region.

IMG_0850
Example of tornado PHI “object” with corresponding probabilistic hazard plume, with a corresponding prototype HazSimp based message.

While NWS forecasters are producing forecast information in the HWT, the EMs and broadcasters are in two separate rooms, analyzing and utilizing the forecast information in job related tasks.  Using the NWS Experimental Data Display (EDD), developed by WFO Charleston, WV, the EMs and broadcasters can view not only the probabilistic hazard information in various graphical formats, but also prototype text-based messaging based on the NWS Hazard Simplification project.  Social and physical science researchers are also in each of the three rooms, working on research goals that will help explore a number of the social and physical science issues related to FACETs.

Tags: None

PHI Prototype Tool Experiment Starts

Monday was the first day of week 1 of the PHI prototype tool experiment in the NOAA Hazardous Weather Testbed.  This experiment is bringing together NWS forecasters, NSSL and OU/CIMMS scientists, emergency managers, broadcasters, and social science researchers from around the country to investigate methodologies to produce and use probabilistic hazard information (PHI) related to hazards from thunderstorms.  The image below shows the team in its initial orientation meeting.

PHI Experiment Week 1 team meeting in the NSSL Dev Lab
PHI Prototype Experiment Week 1 team meeting in the NSSL Dev Lab (Photo by Lans Rothfusz)

The team was going through initial orientation for PHI production and evaluation as severe storms were rapidly developing over central Oklahoma Monday afternoon.  Forecasters produced test experimental PHI forecasts for the supercell that produced the intense tornado in Garvin and Murray counties during the mid afternoon hours as part of the group’s training in preparation for the more formal testing the rest of this week.  This testing will go into full gear this afternoon, with the team working an archived case as well as realtime weather, likely focusing on expected severe weather either in the Ohio Valley region or in Texas.

Tags: None

HWT Experiments in Full Swing

This week saw the first full week of testing in the NOAA Hazardous Weather Testbed directly related to FACETs research and development efforts.  Operational forecasters from NWS offices in Norman and Pittsburgh worked with scientists from NSSL, University of Oklahoma’s Cooperative Institute for Mesoscale Meteorological Studies (CIMMS), the NWS Warning Decision Training Division,  and NOAA’s Environmental Sciences Research Lab (ESRL) to test software and techniques to generate probabilistic hazard information (PHI) utilizing Hazard Services software.  Hazard Services is a software package being developed for NWS forecasters to use to generate hazardous weather forecasts.  This week’s experiment thus not only tested the concepts of how forecasters can produce PHI guidance – it also enabled scientists and software engineers to evaluate the process by which it can be done using this software which will eventually be operational in the NWS.   Two additional weeks of this experiment will be conducted later in May and in early June.

NWS forecasters, research scientists from NSSL, CIMMS, and NWS WDTD, and social scientists from the University of Akron, working as part of the PHI-Hazard Services Experiment in the NOAA Hazardous Weather Testbed. (NSSL Photo)

This upcoming week (May 9-13) will see the first week of the PHI Prototype Experiment.  This experiment will bring together NWS forecasters, emergency managers, and broadcast meteorologists from around the country to work with physical and social scientists to test how PHI can be generated and utilized during severe weather events.  We’ll be sharing updates from the experiment (and more information about FACETs and PHI)  as the week progresses.

Tags: None