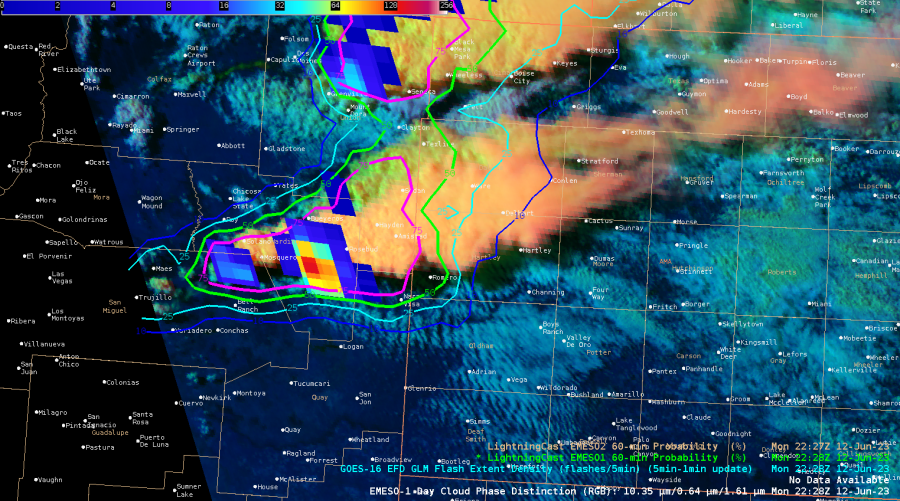
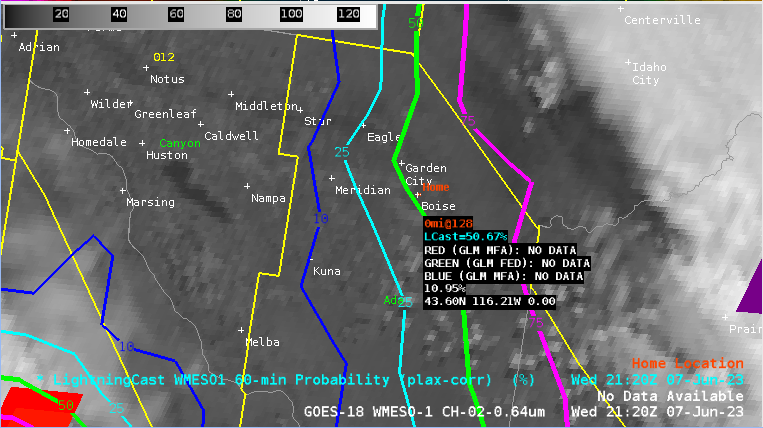
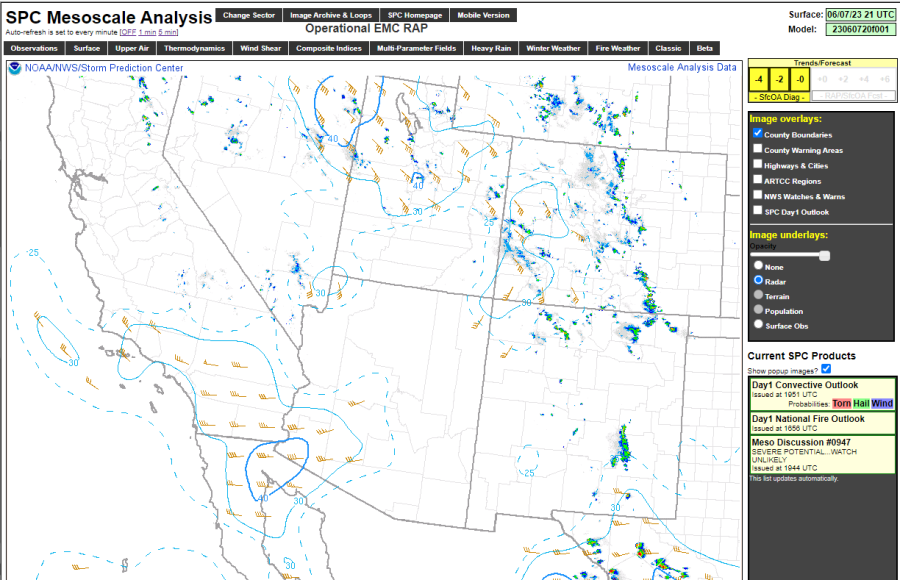
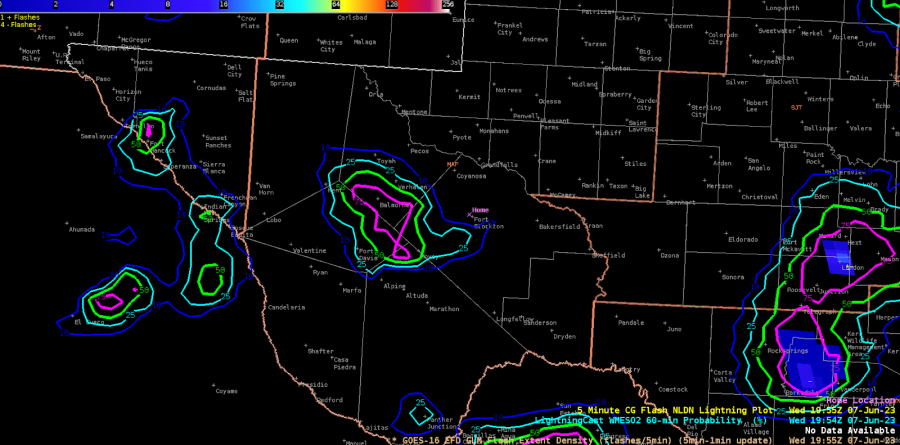
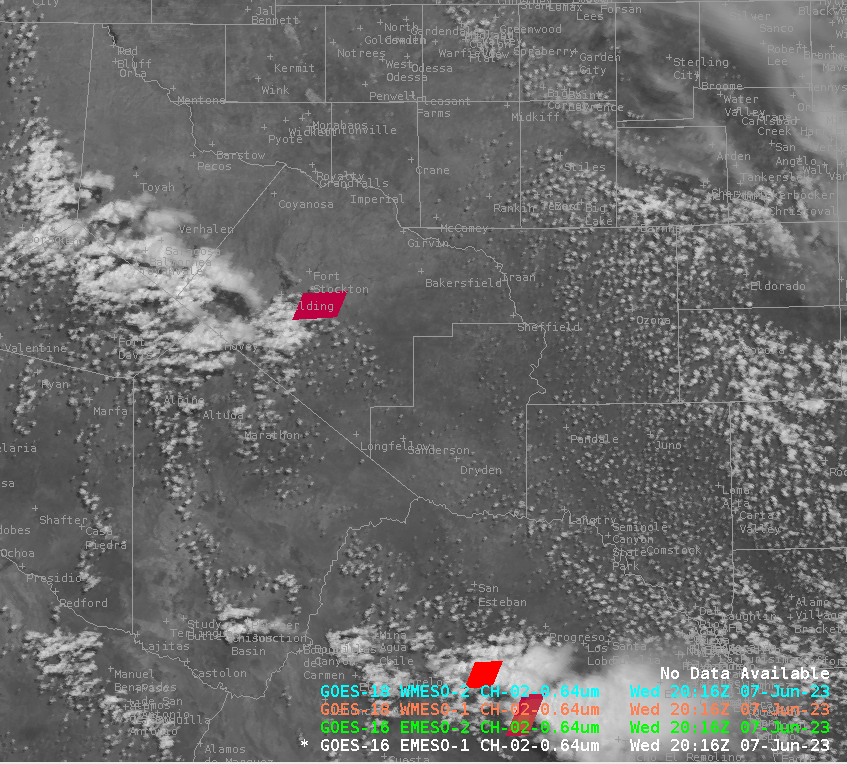
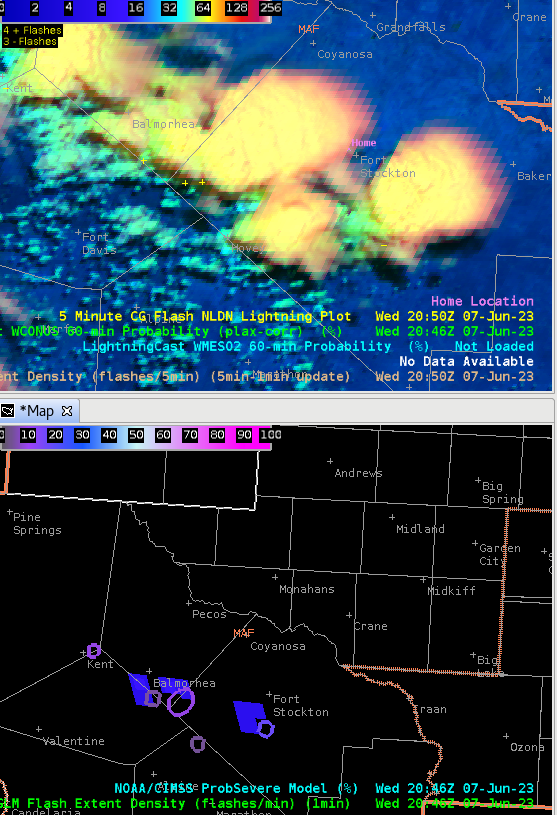
Convection has been slow to initiate in W TX, but we’re finally seeing some vertical extension and greater texture in the CU field on the NE side of the mountains. LightningCast is now showing higher probabilities in this area, after several scans of sub-50% contours.
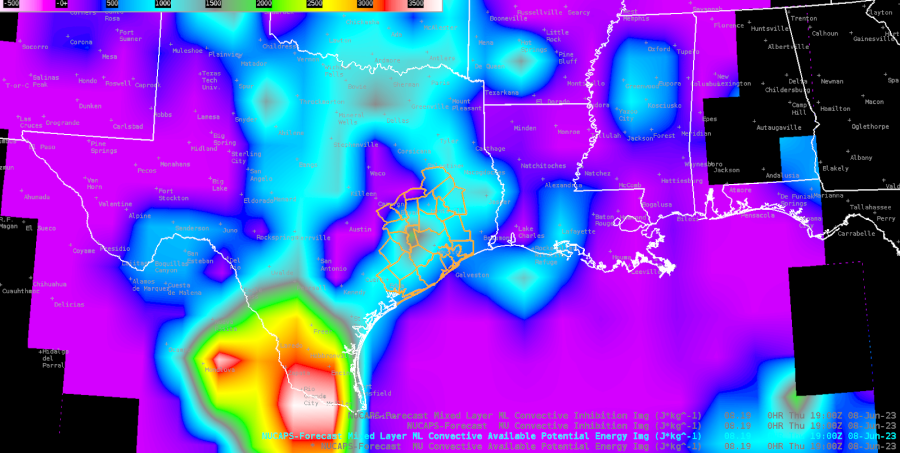
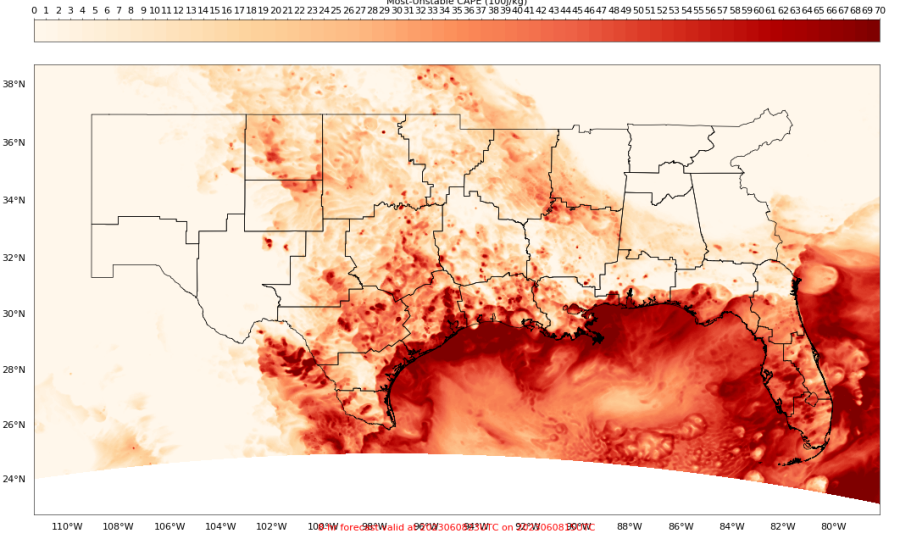
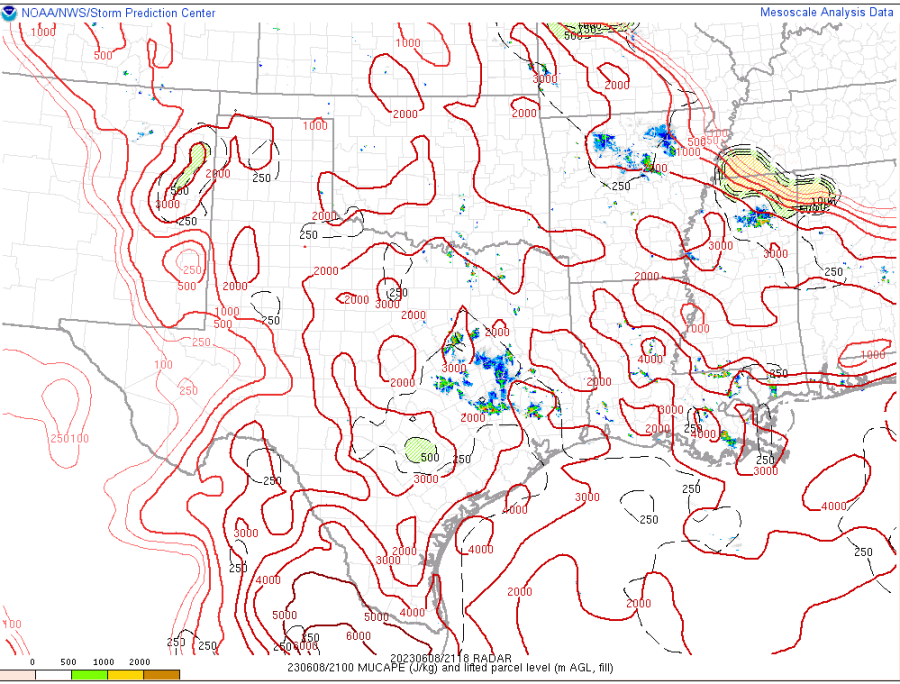
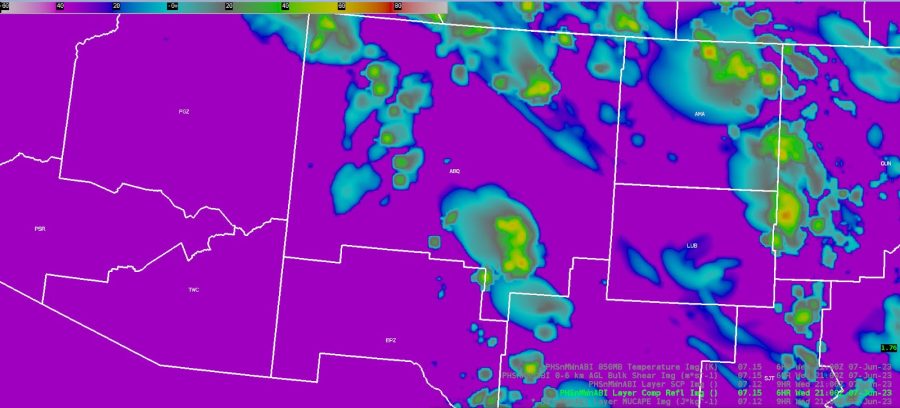
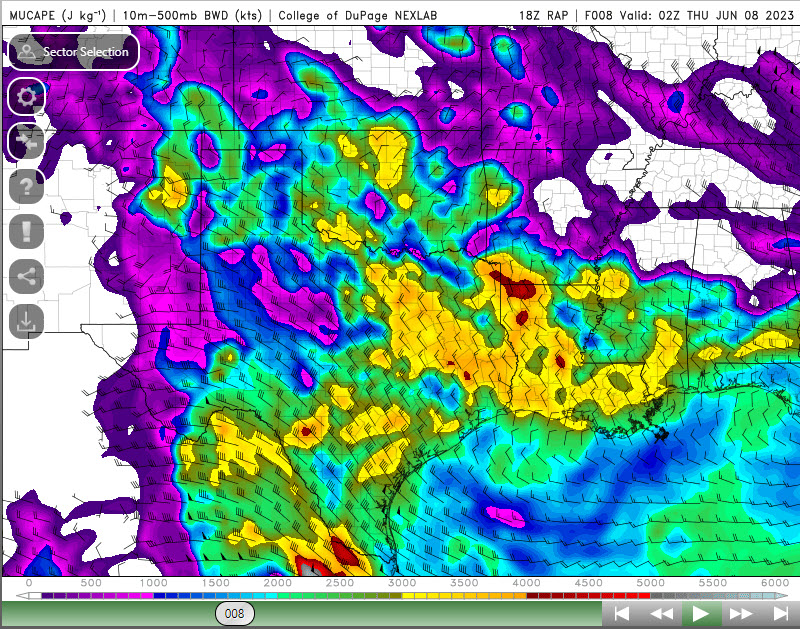
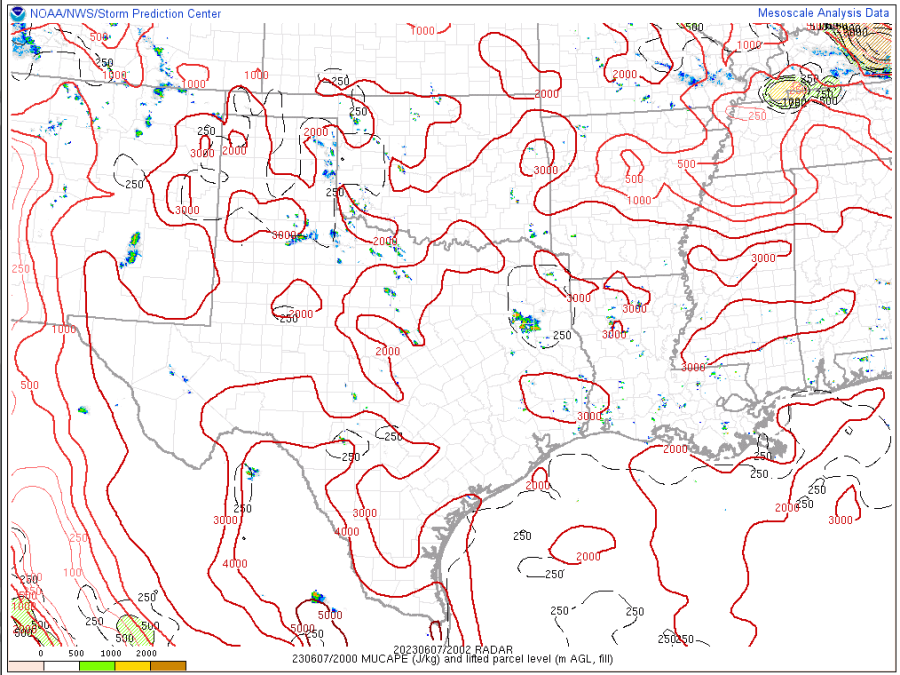
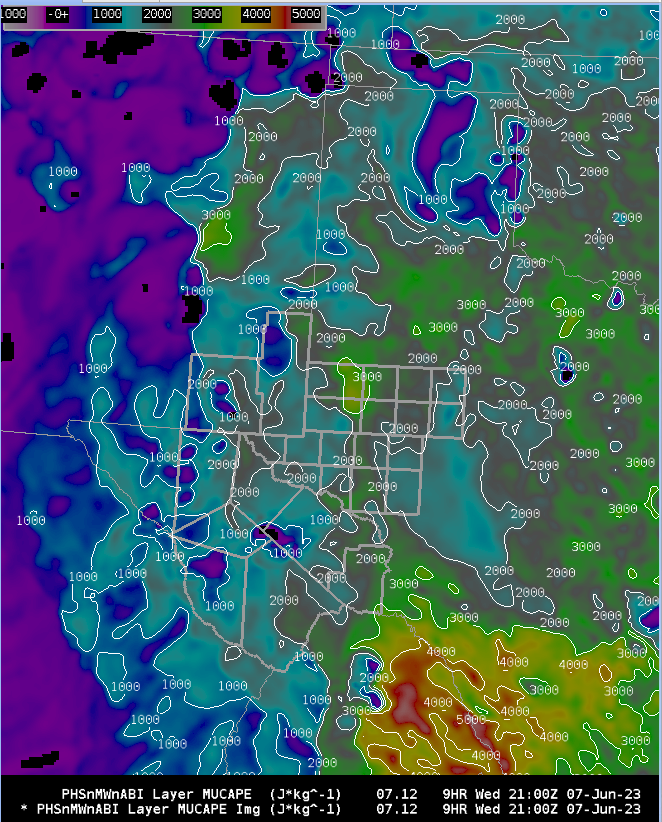
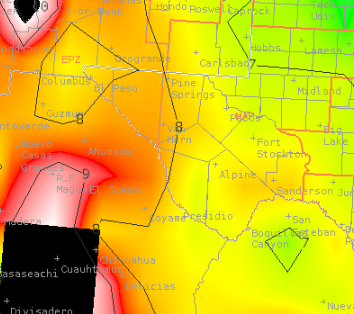
We are seeing good destabilization. The PHS MUCAPE compares quite well to the SPC mesoanalysis.
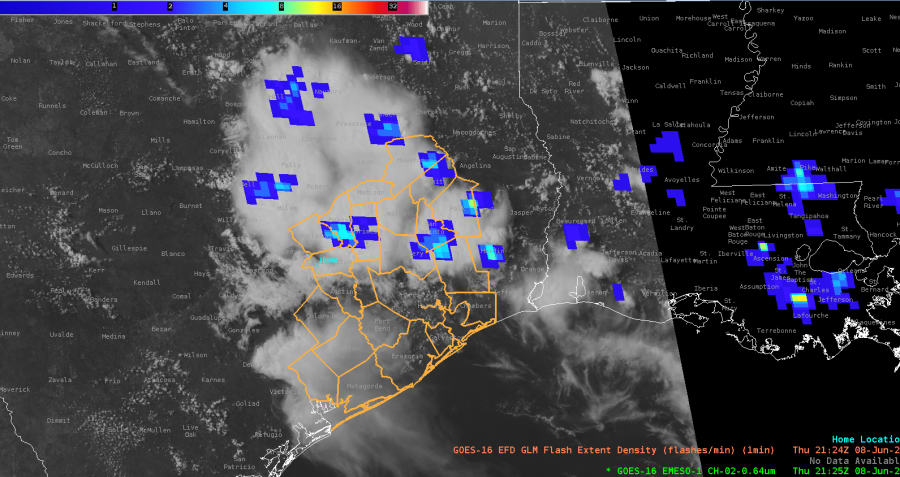
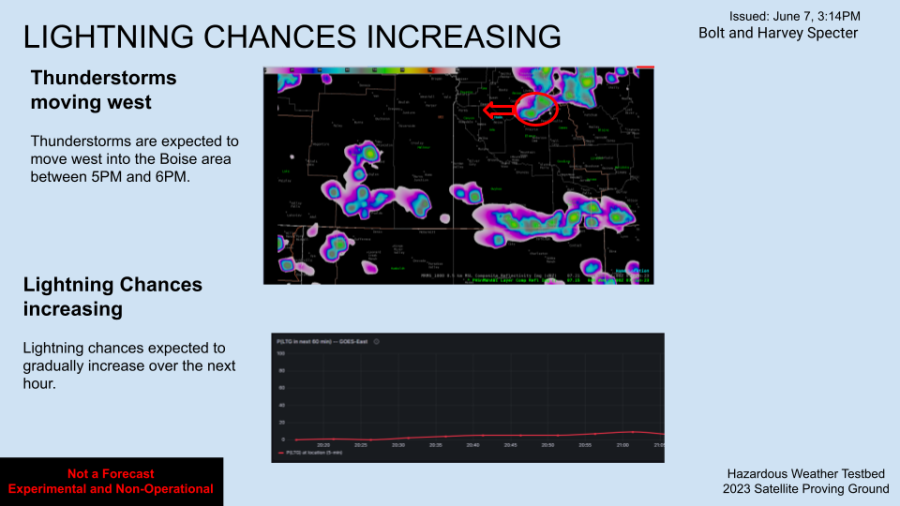
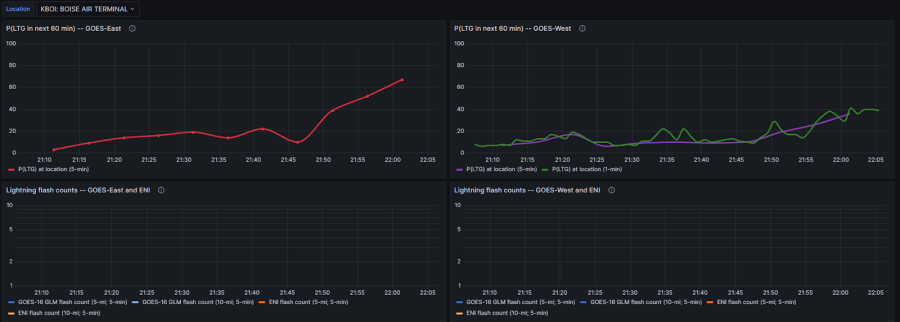
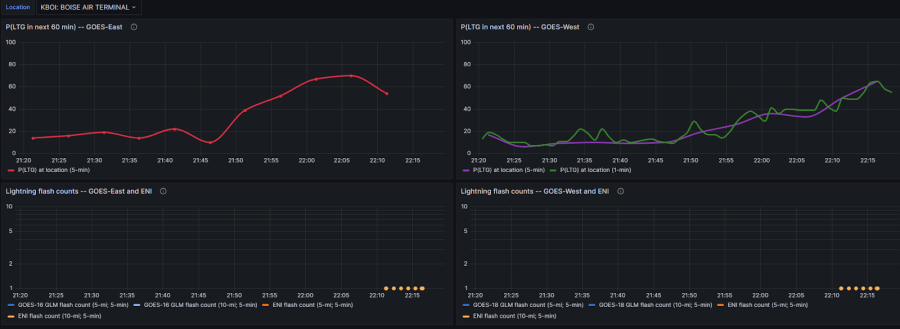
LightningCast probabilities continue to climb, and we’re finally seeing a few flashes on GLM imagery.
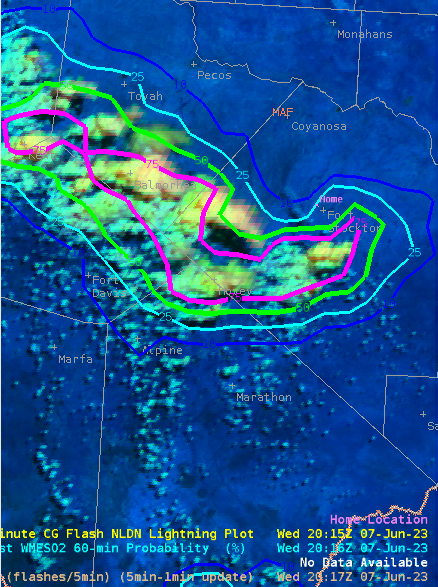
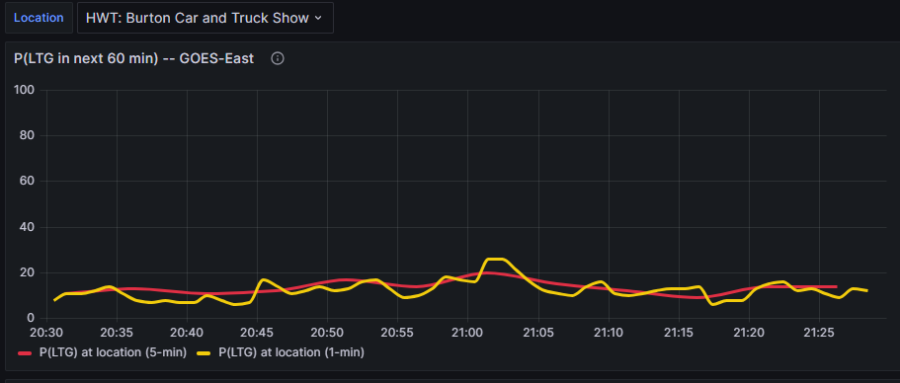
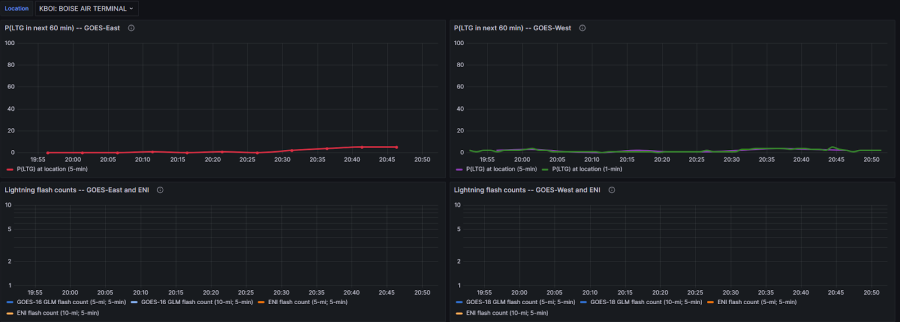
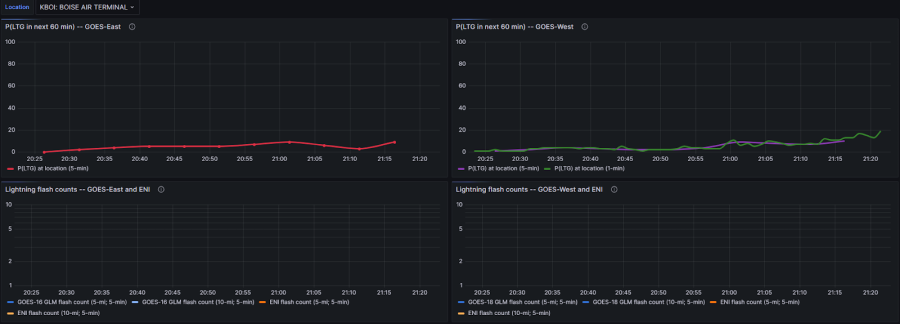
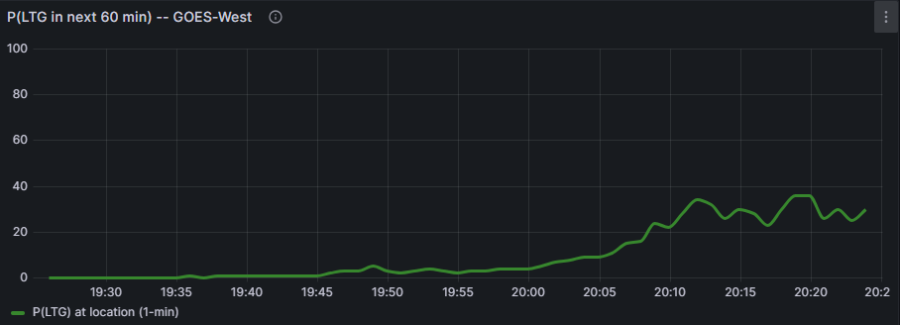
Our LightningCast meteograms are finally showing some higher probs in the next hour near our DSS site in Fort Stockton.
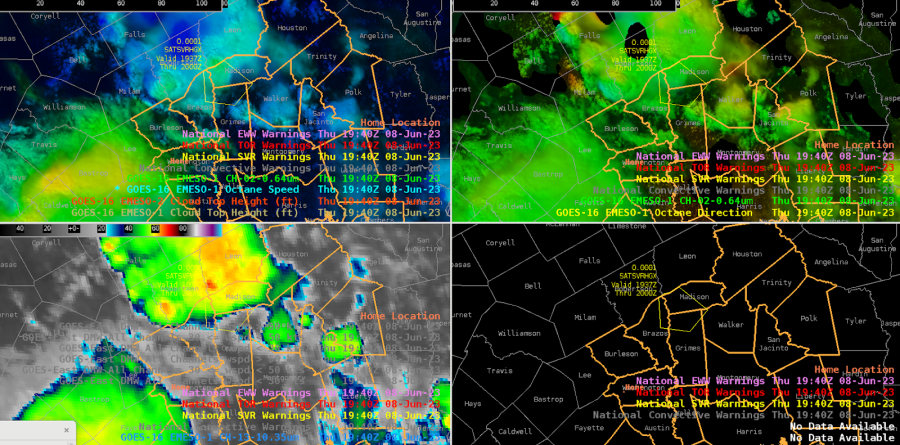
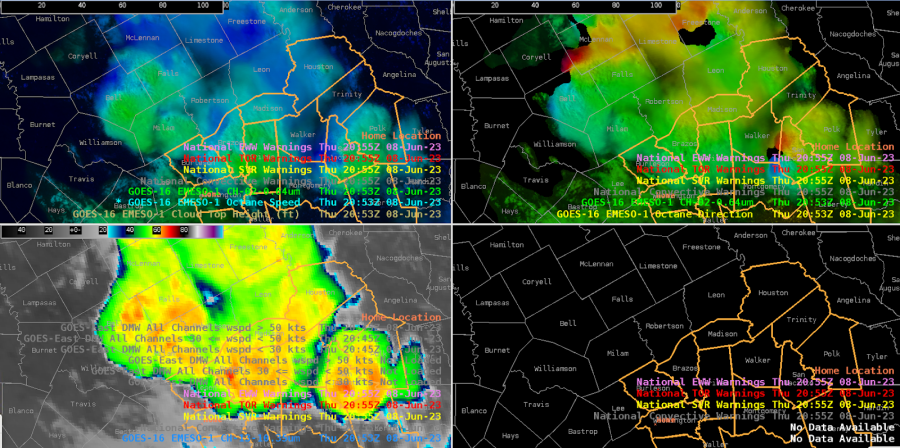
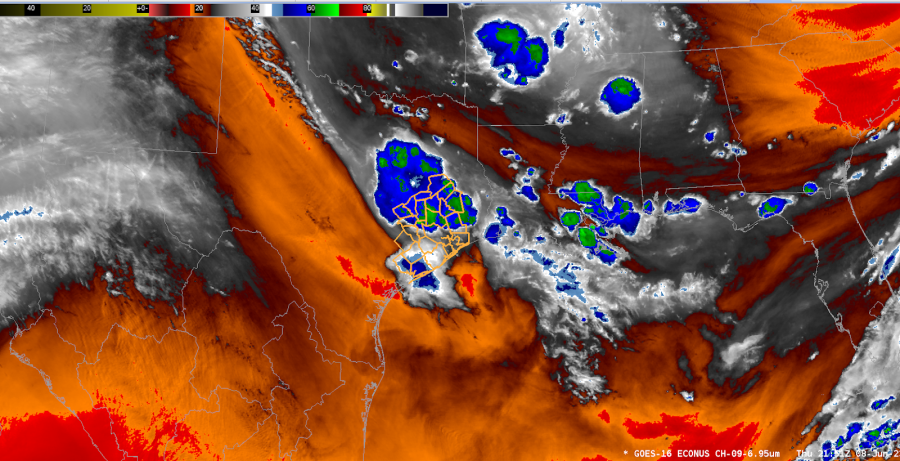
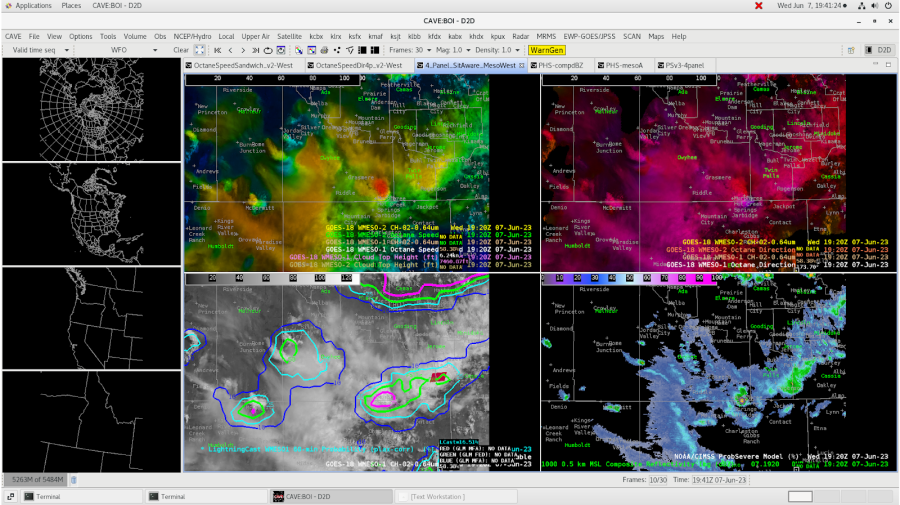
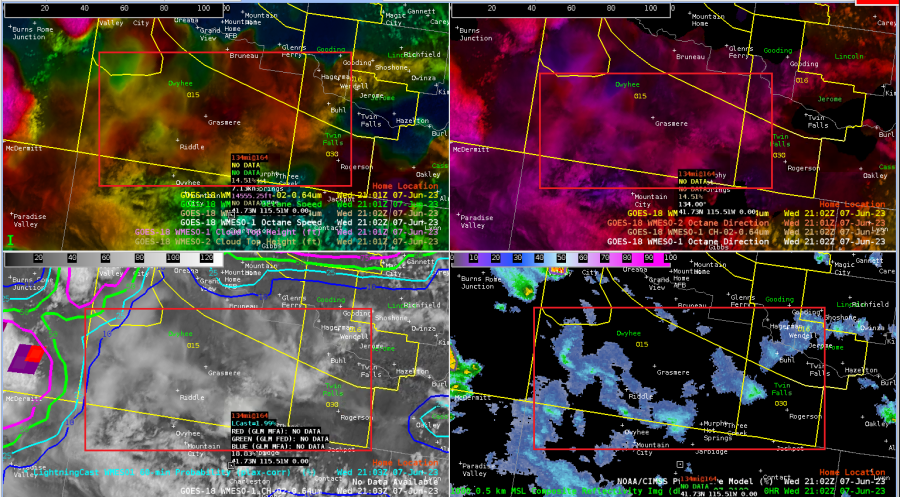
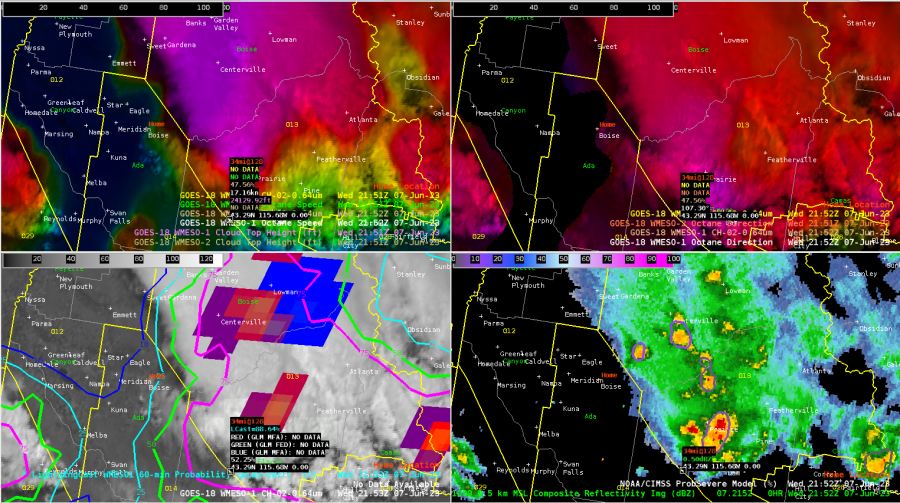
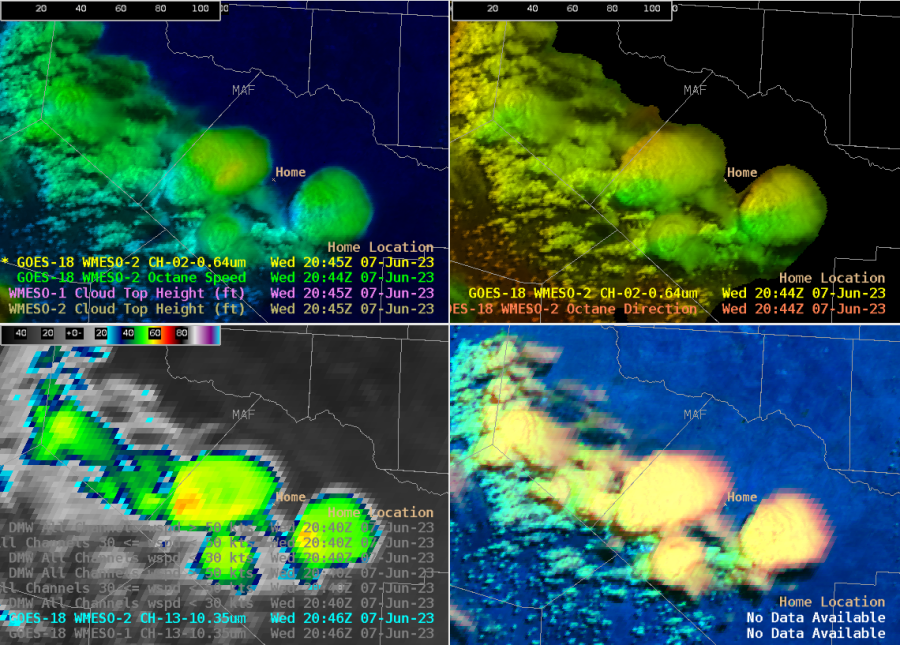
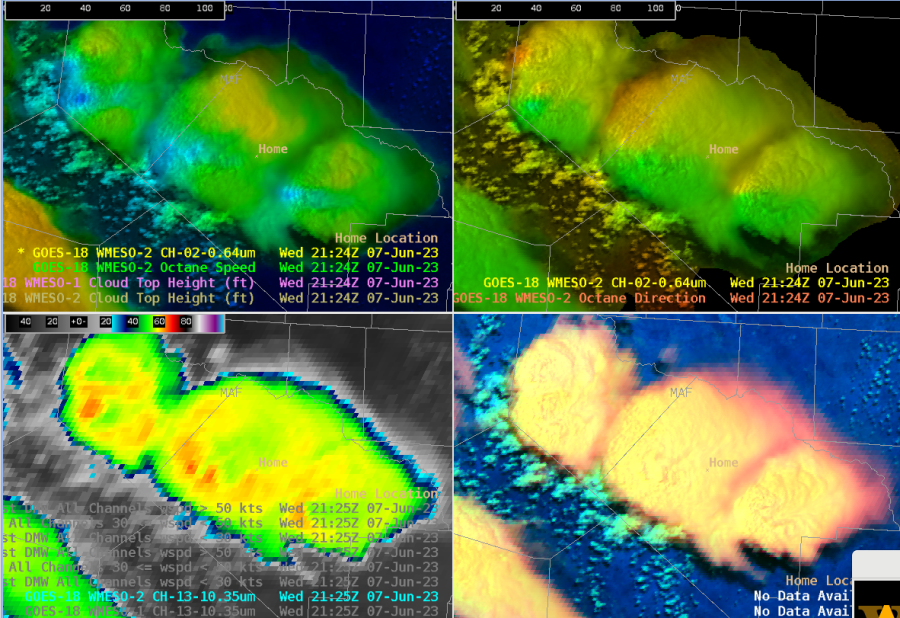
We’re now seeing more defined features in the Octane imagery, including cloud top divergence signals and cooler brightness temps, down to -63C. But our ProbSevere markers remain low.
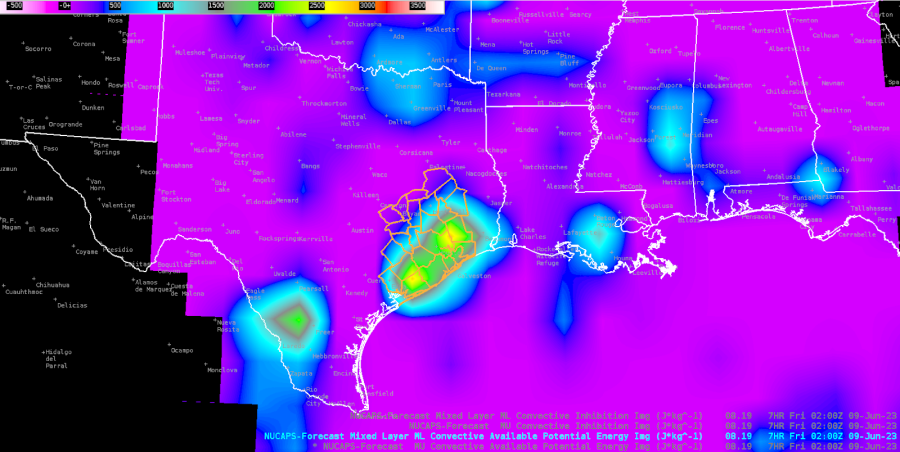
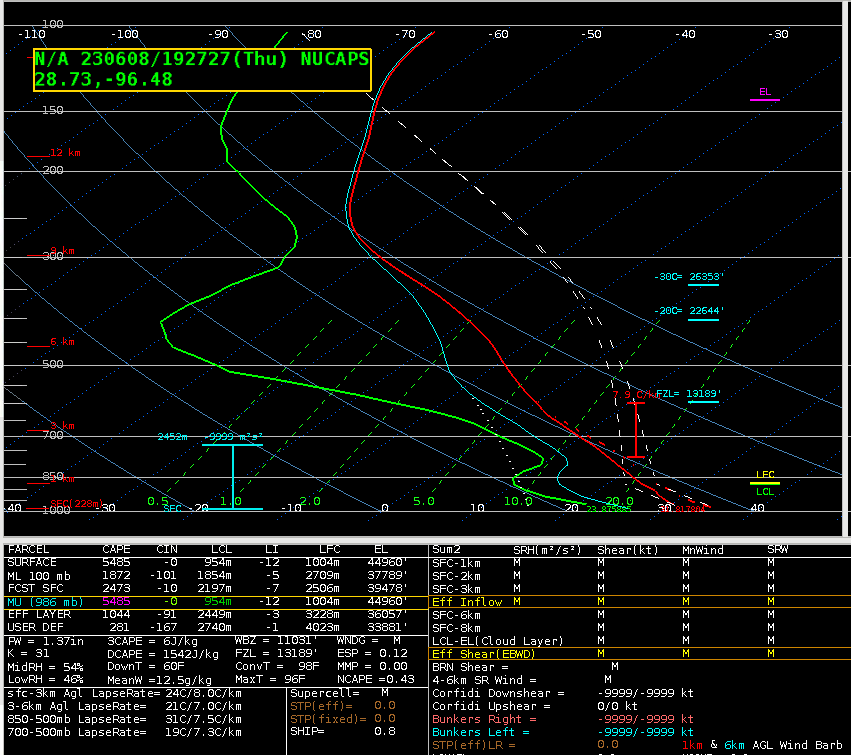
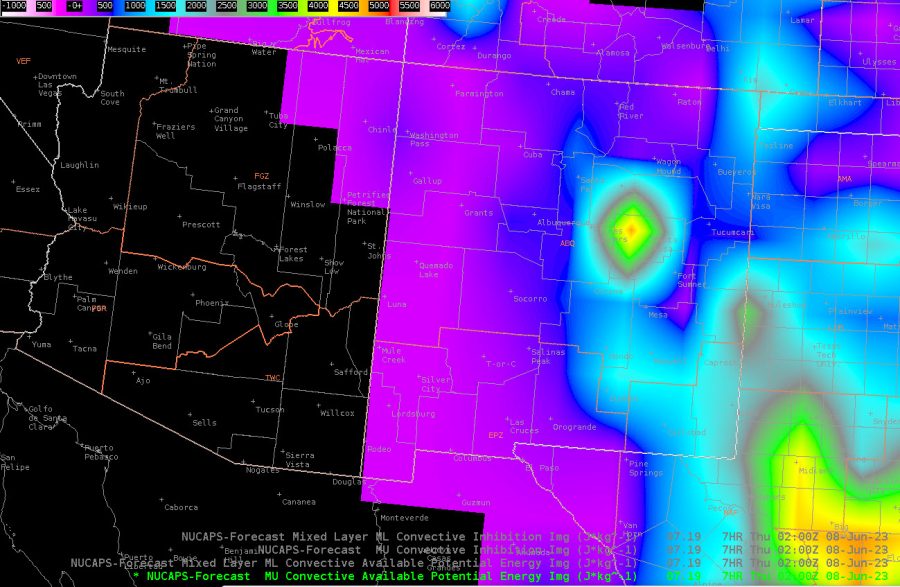
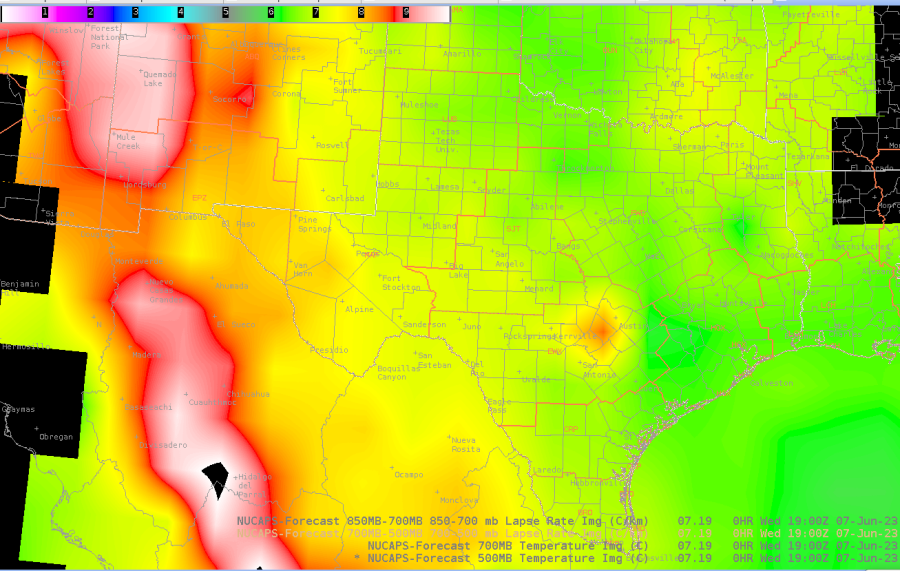
Looking at the NUCAPS-Forecast initialization at 19z, the mid level lapse rates are lower in areas NE of the higher terrain, where convection has been a bit slower to strengthen, as compared to the storms to our SW over Mexico, where MLLRs are higher.
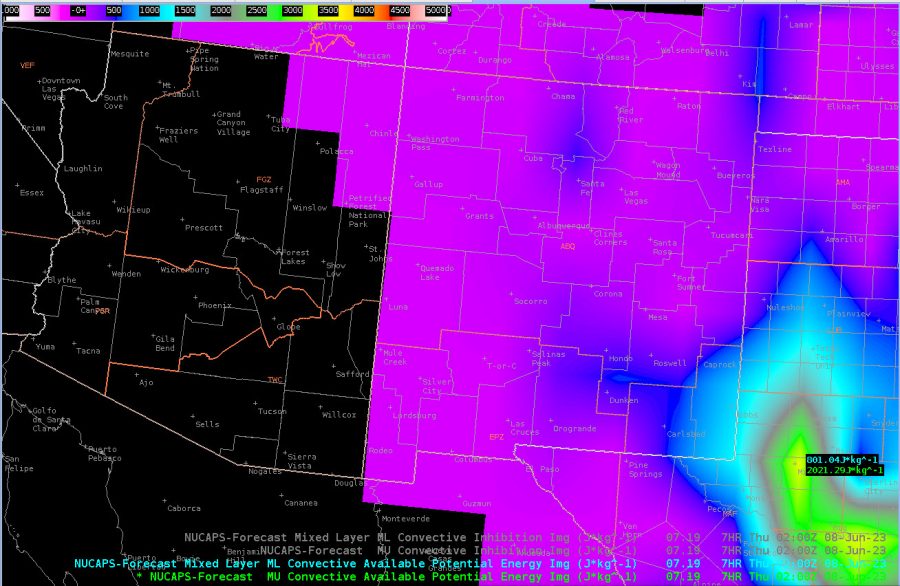
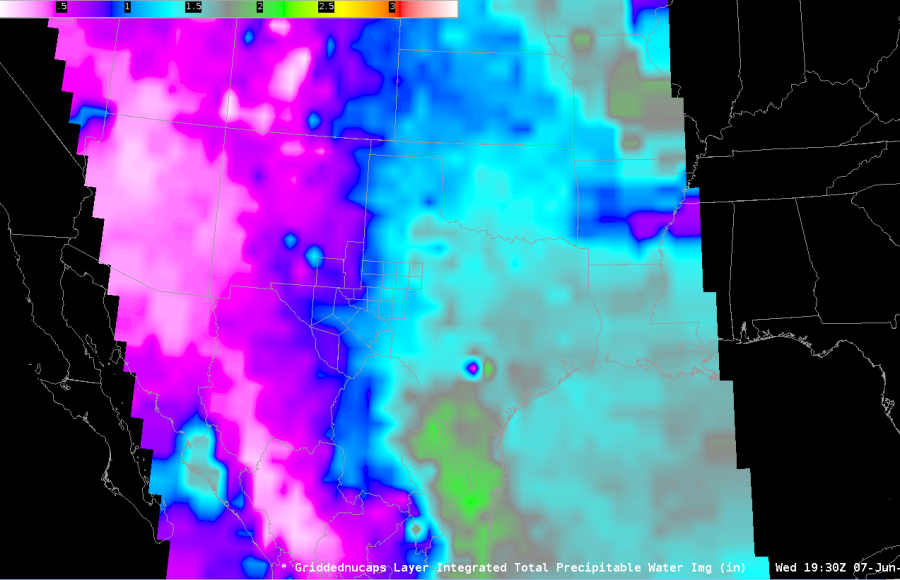
The new TPW imagery from NUCAPS shows well the delineation of the moist air to the E and drier air to the W.
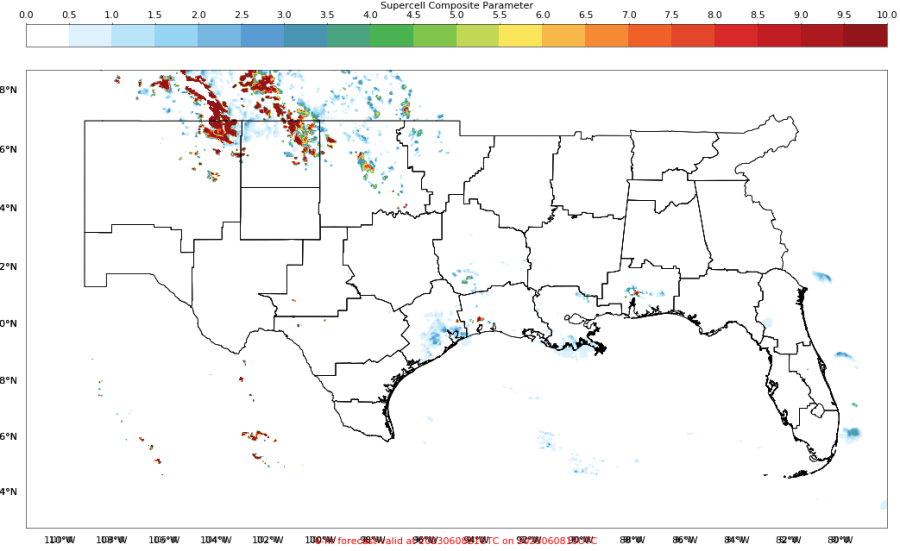
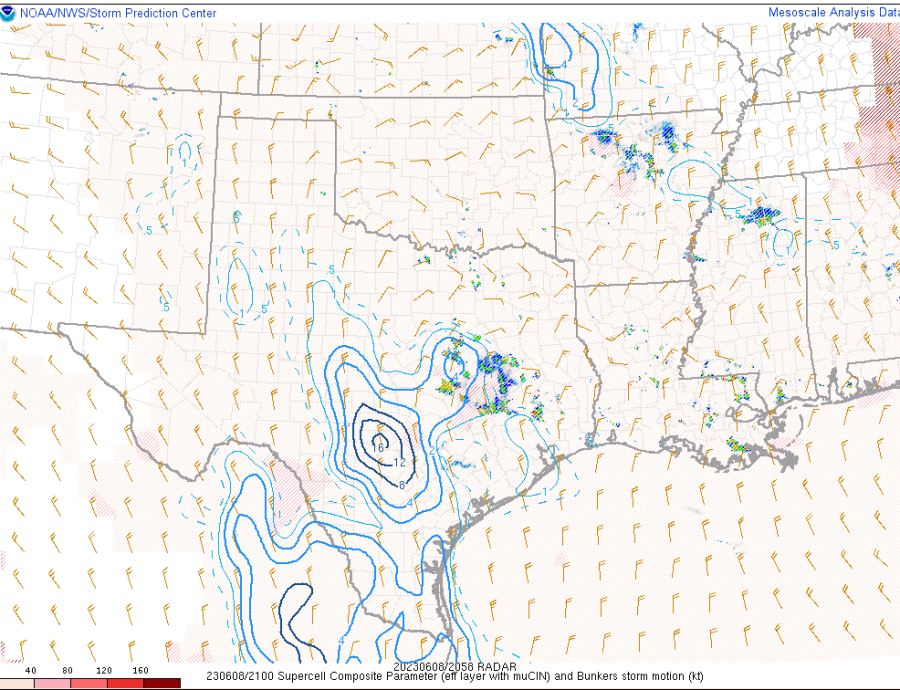
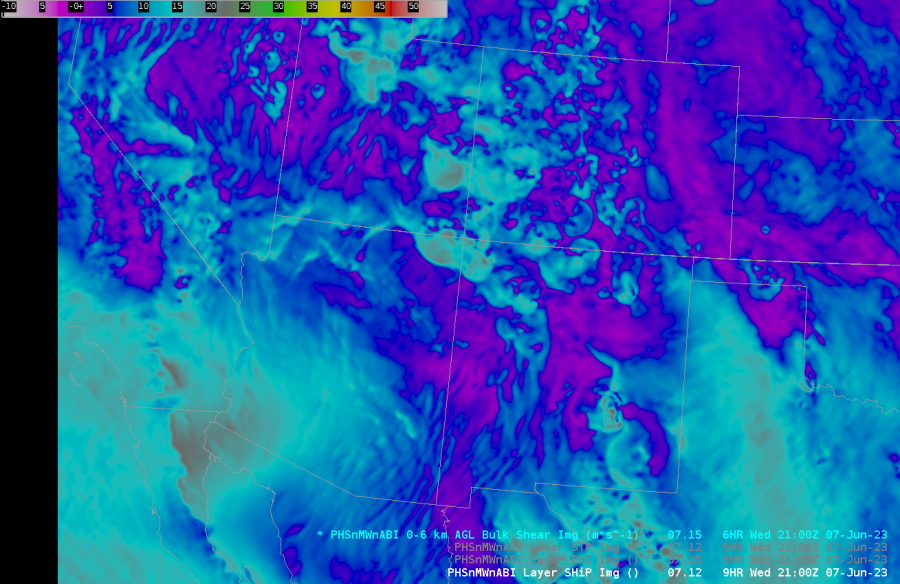
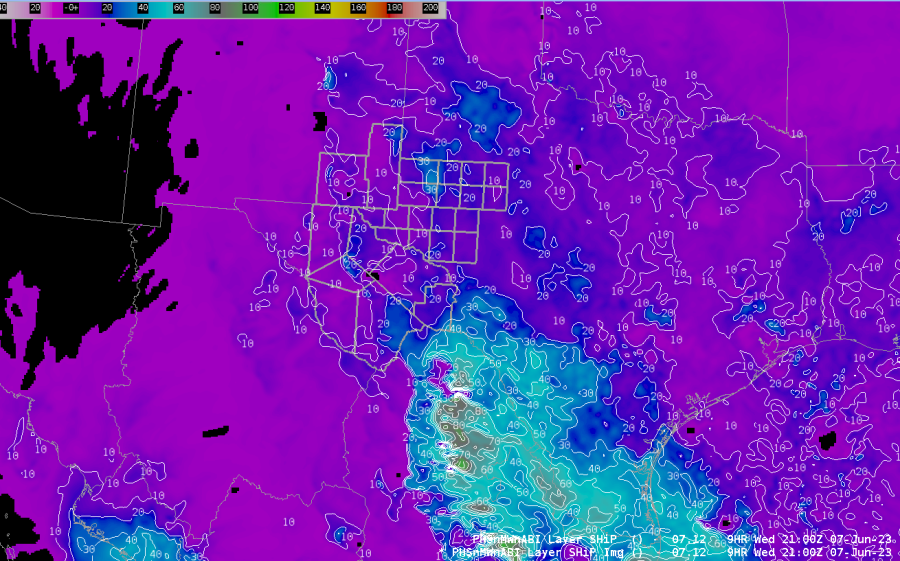
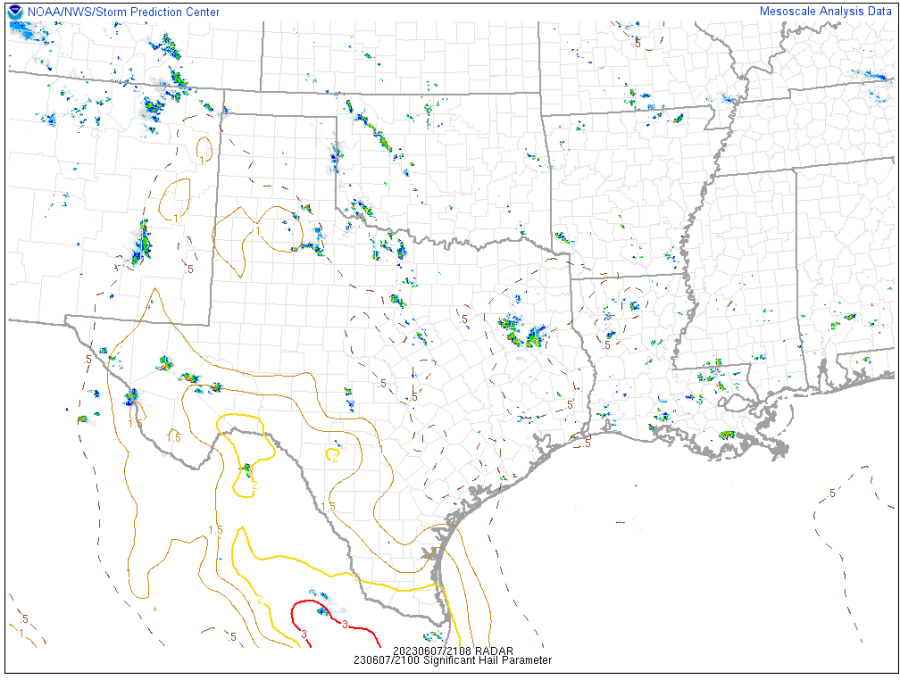
The PHS SHiP pattern looks good, but its magnitudes appear way off, compared to the SPC meso page and how SHiP is calculated.
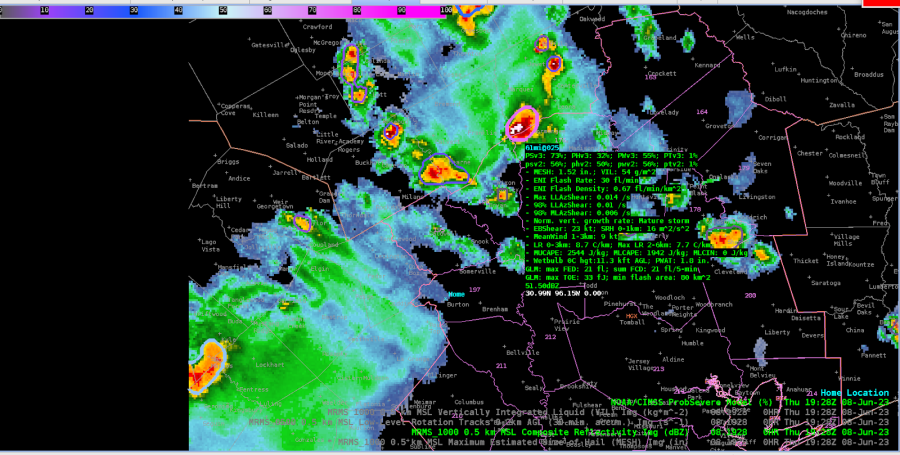
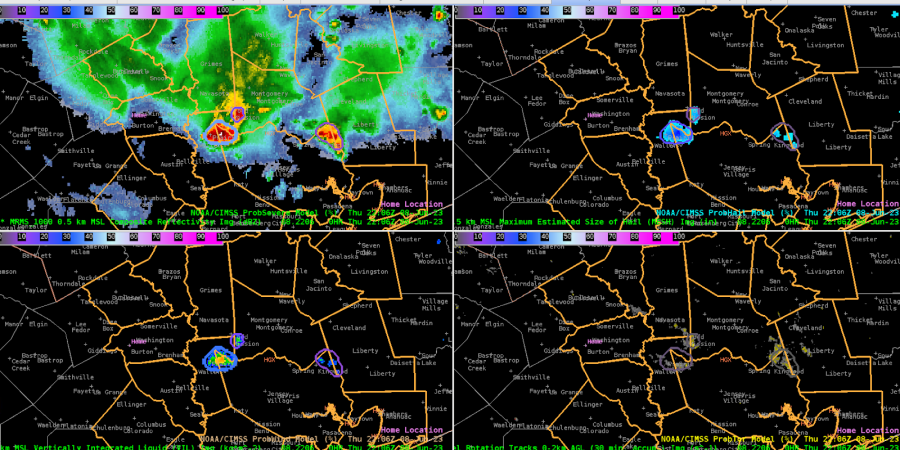
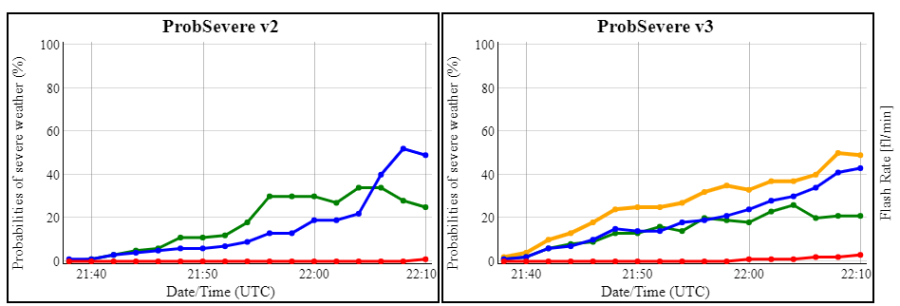
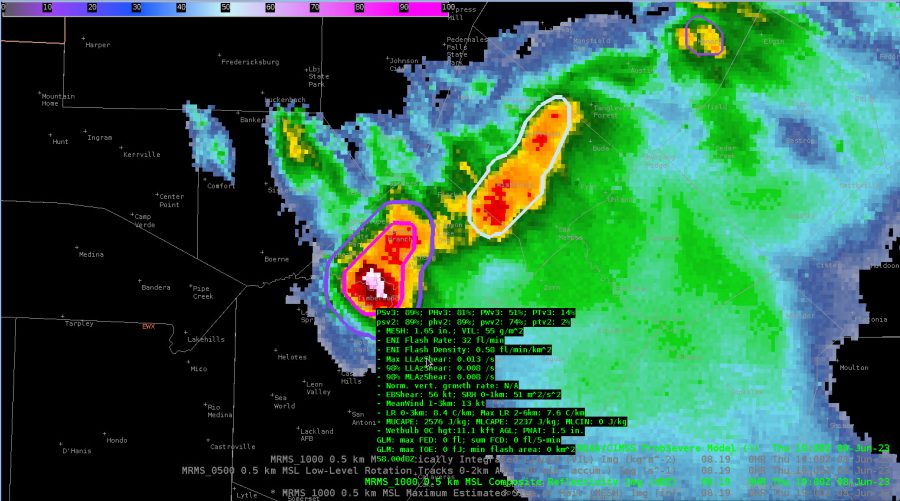
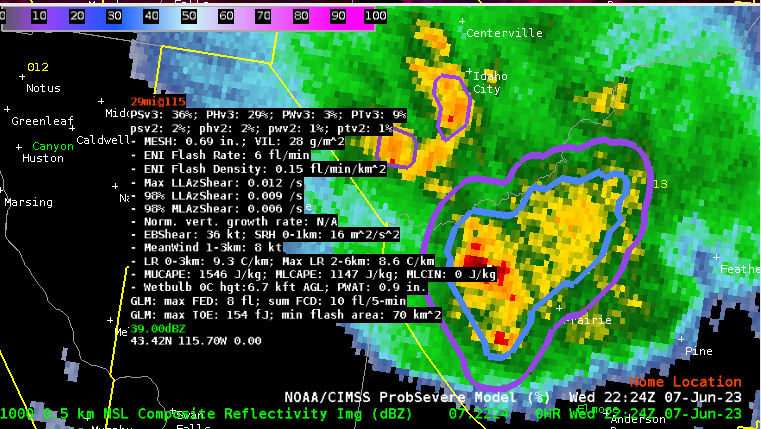
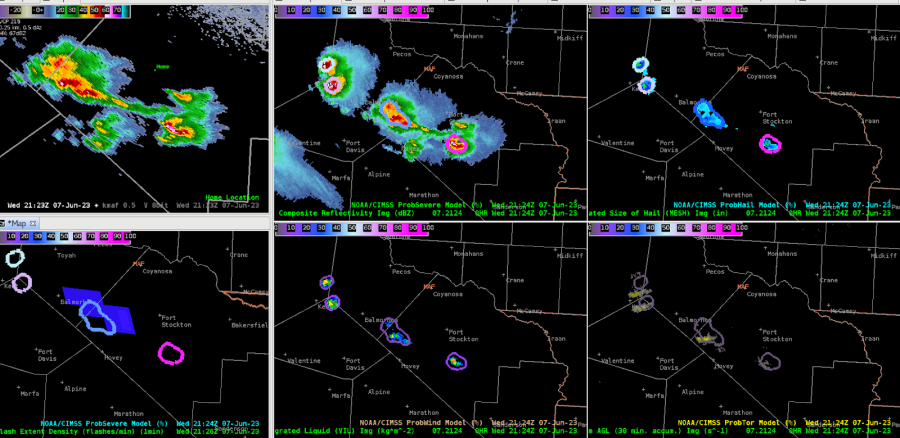
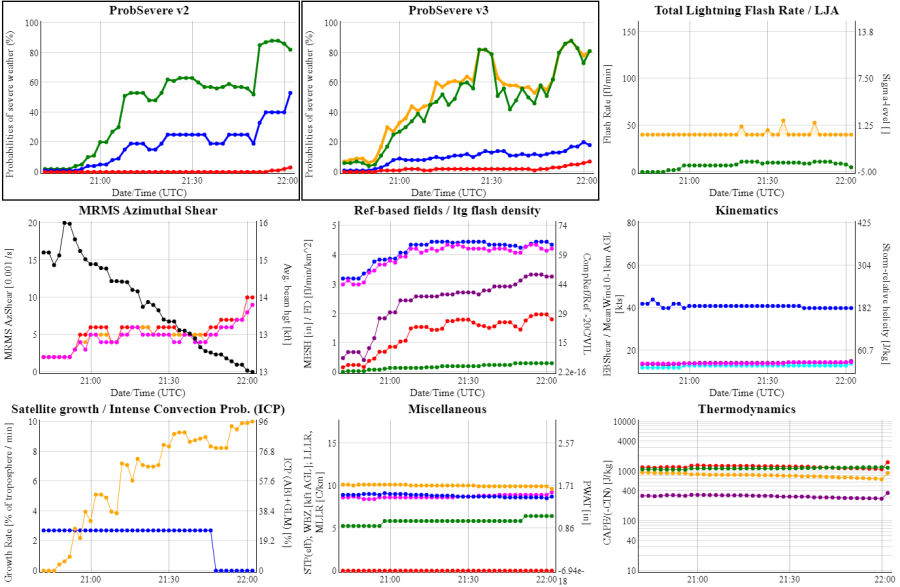
Hail probs are exceeding 80% now on ProbSevere, although our GLM lightning is rather low! Interesting how assumed large hail presence doesn’t necessarily equate to classic charge separation that would prompt high electrification.
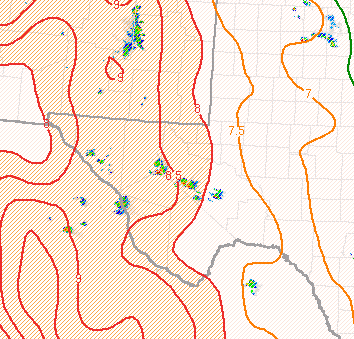
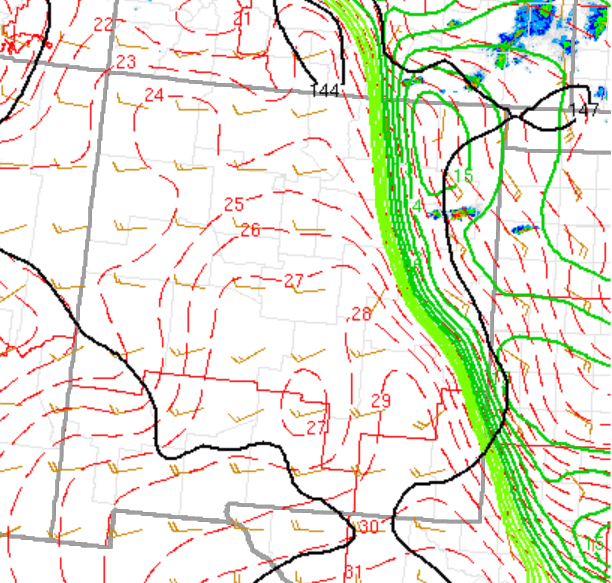
21z 700-500mb comparison of SPC Meso (top) vs 21z NUCAPS-Forecast (bottom)
– Some differences in lapse rates between the two, with NUCAPS about .5-1°C/km lower than SPC Meso page.
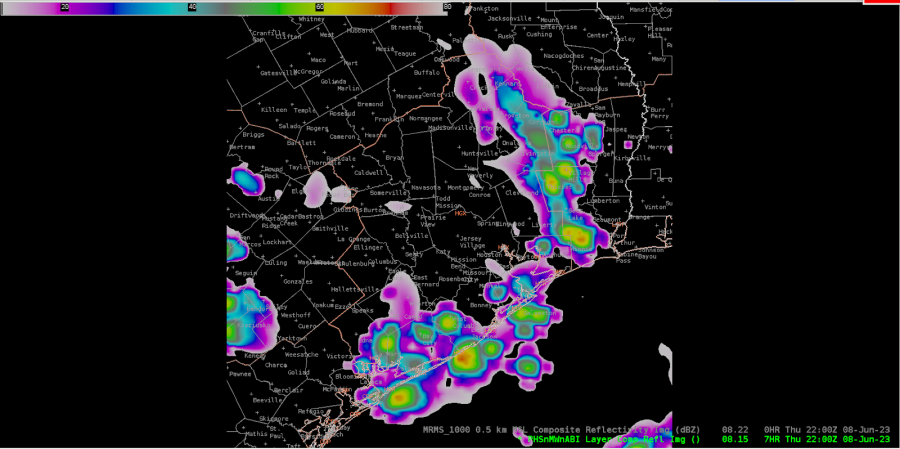
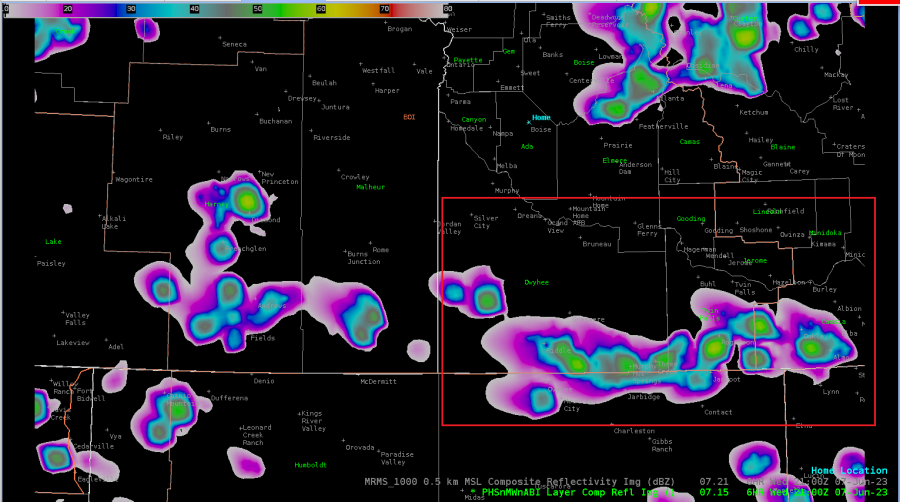
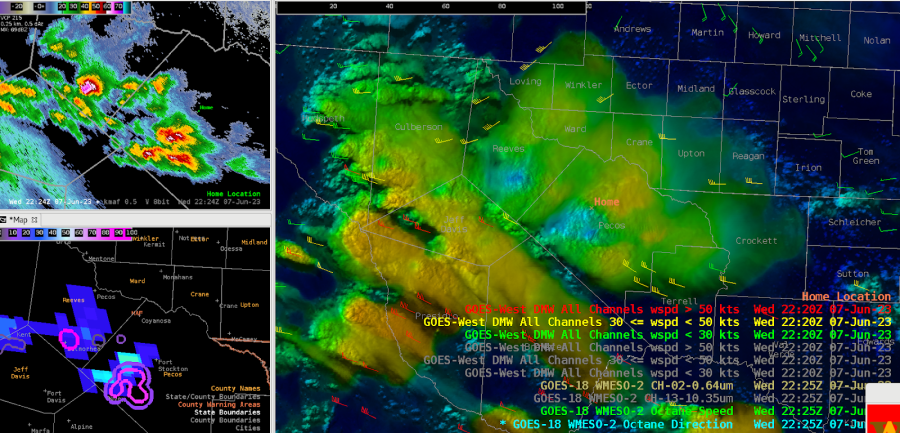
ProbSevere, Octane, and IR imagery supports warning issuances for Reeves and Pecos counties.
With the warning now out for Reeves and Jeff Davis counties, this storm continues to exhibit high hail probabilities on PSv3.
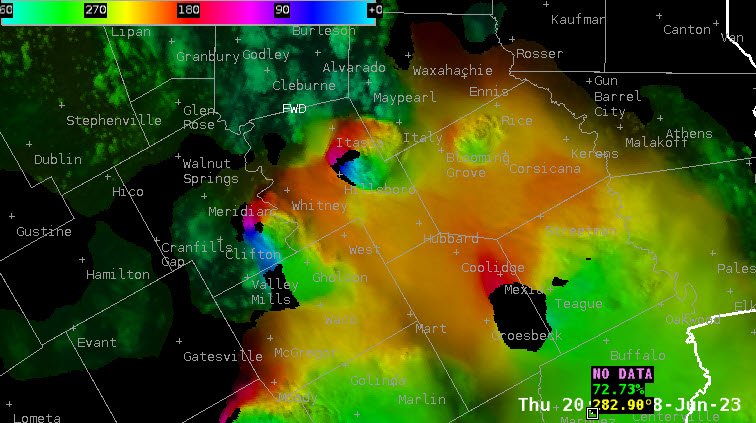
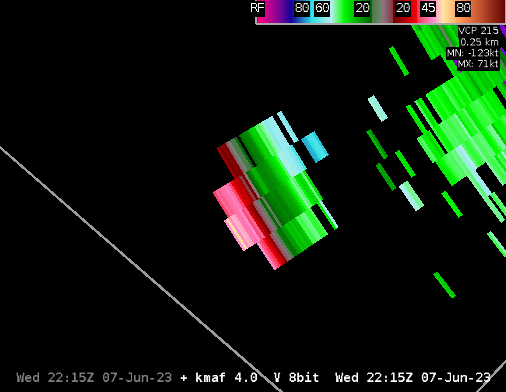
Up to 120 kts of ST divergence with the warned cell (at about 50 kft).
Interesting how ProbSevere identifies objects. There appears to be 3 separate updrafts in Pecos county, however PS is seeing one object.
– Edgar and StormofCentury


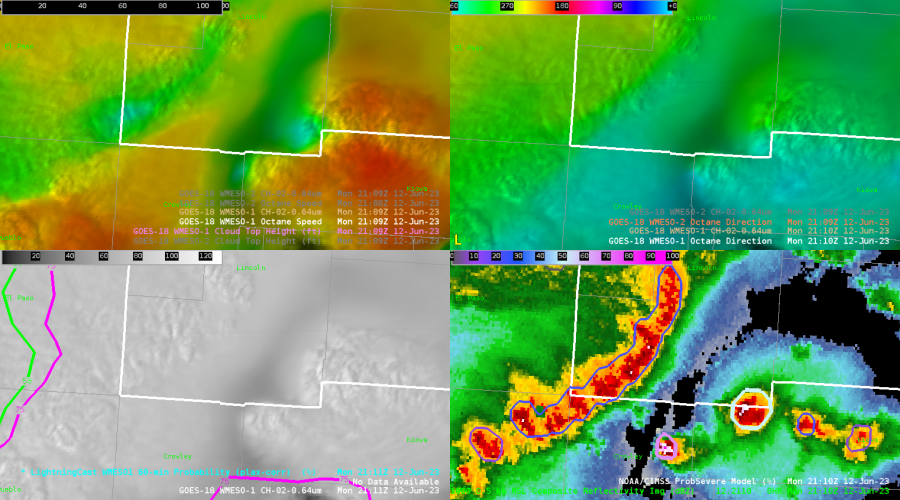
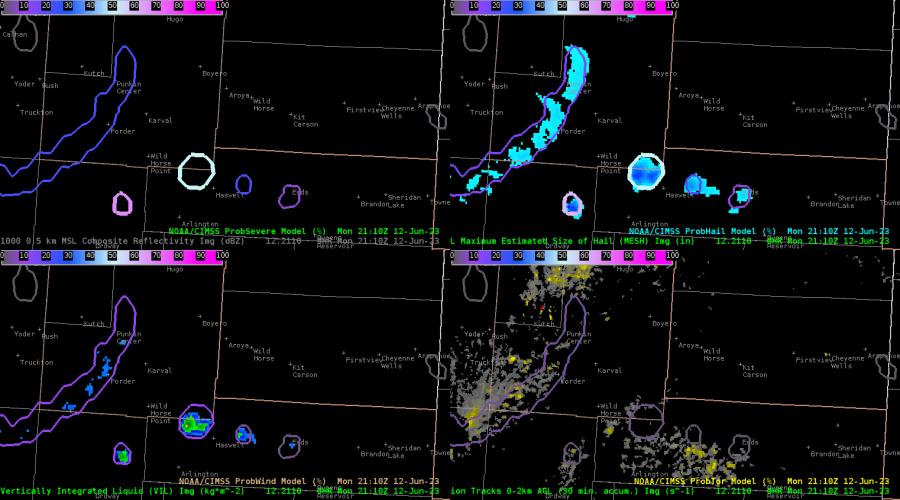
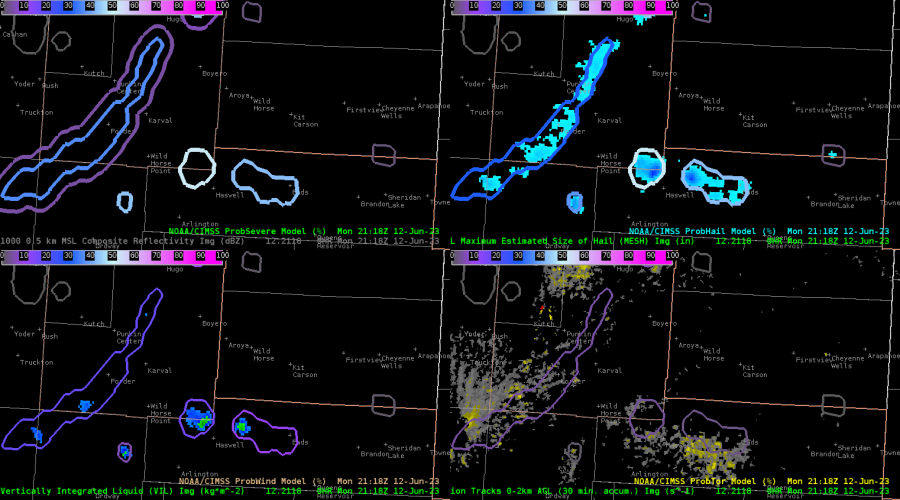

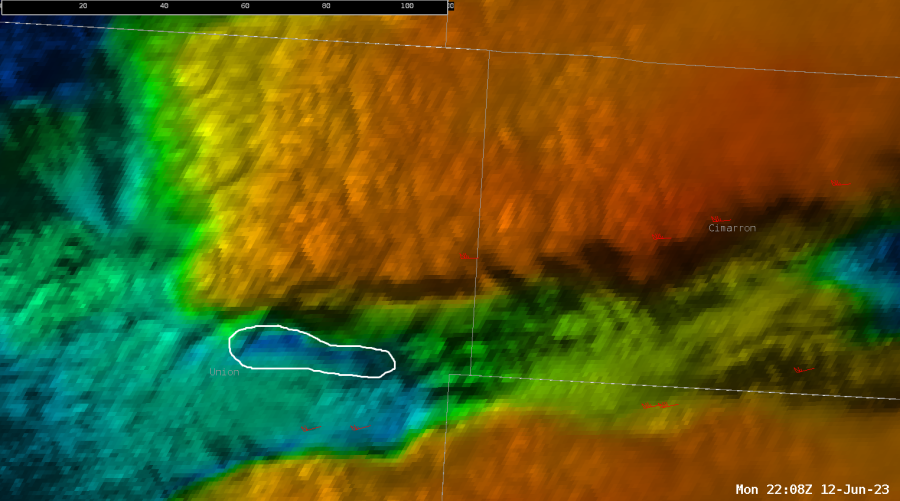
 Figure 1
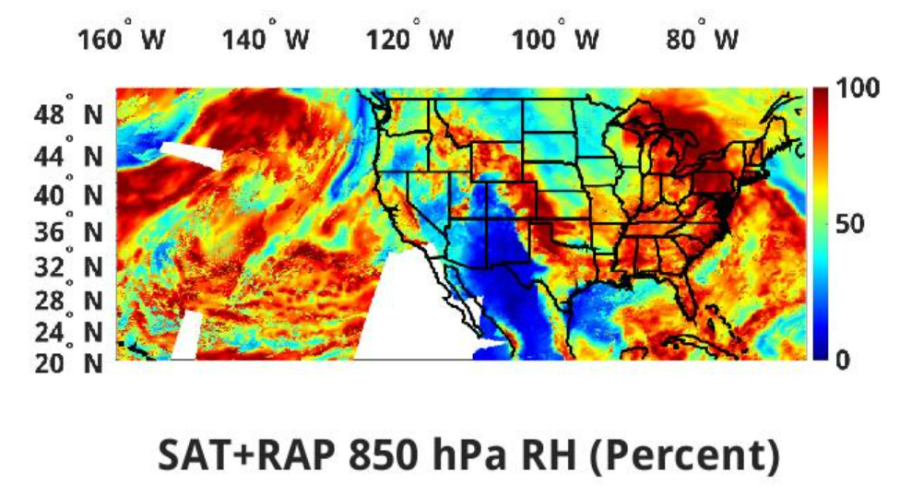 Figure 2