Looking at multiple levels of optical winds can be useful in analyzing the amount of wind shear over an area in near-real time. In this case, the tool shows limited wind shear, so one would expect storms to be a bit more short lived. Would it be possible to add wind shear fields directly into this tool for quicker analysis?
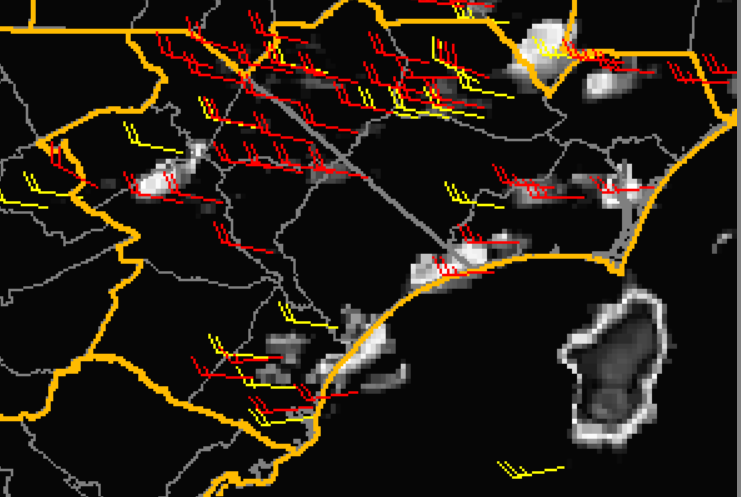
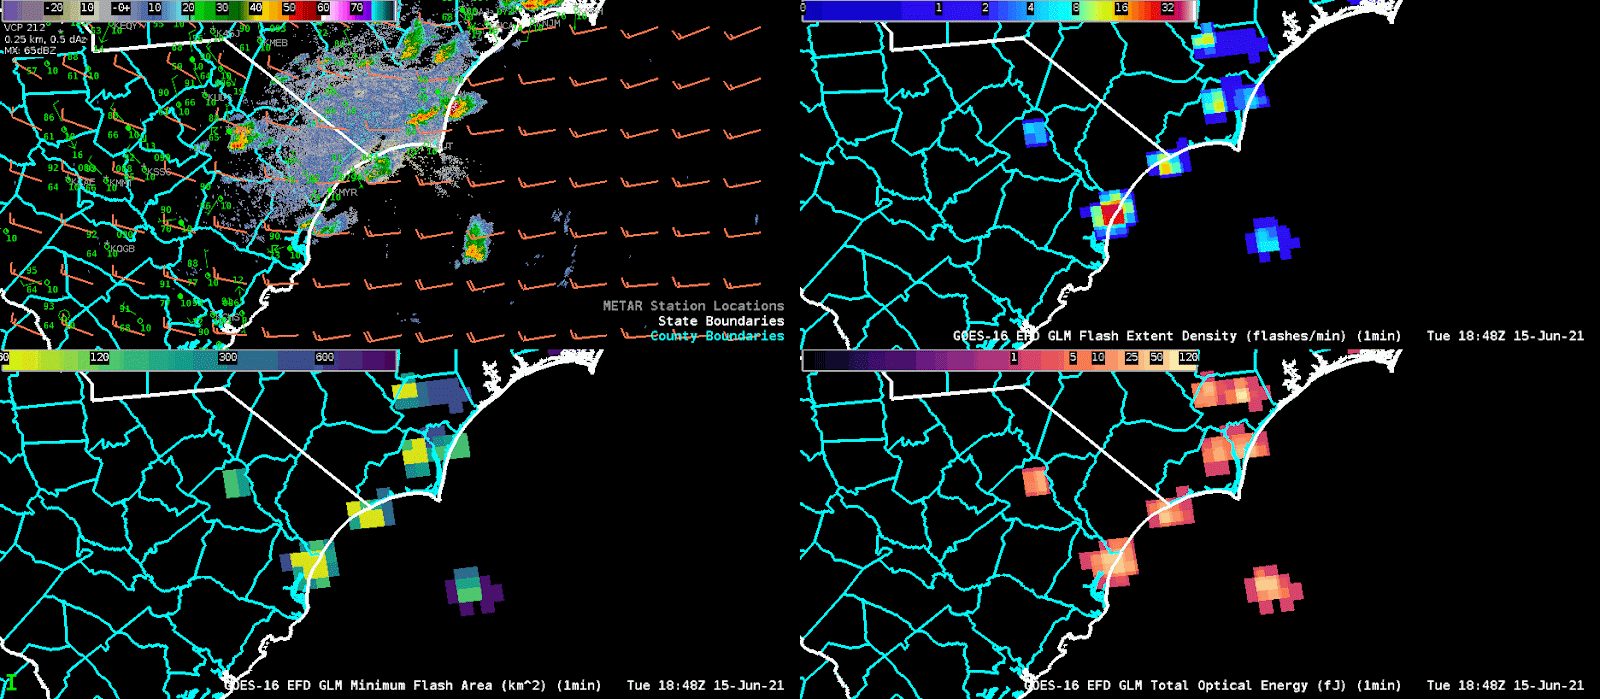
Optical winds for the ILM CWA on 6/15 at 18Z showing little difference in the winds between the 800-600mb and 600-400 mb levels.4 panel of the GLM data at ILM around 19 UTC illustrates Flash Extent Density (top right), Minimum Flash Area (bottom left) and Total Optical Energy (bottom right). We adjusted the colormap of the minimum flash area so that we could identify the updrafts more easily since the minimum flash areas were under 100km^2 and the default map was set to cover images up to 2000km^2. This allowed us to identify which storms featured the strongest updrafts which when combined with data from the Flash Extent Density, we could watch for storms that were strengthening and thus posed a greater need for a warning.
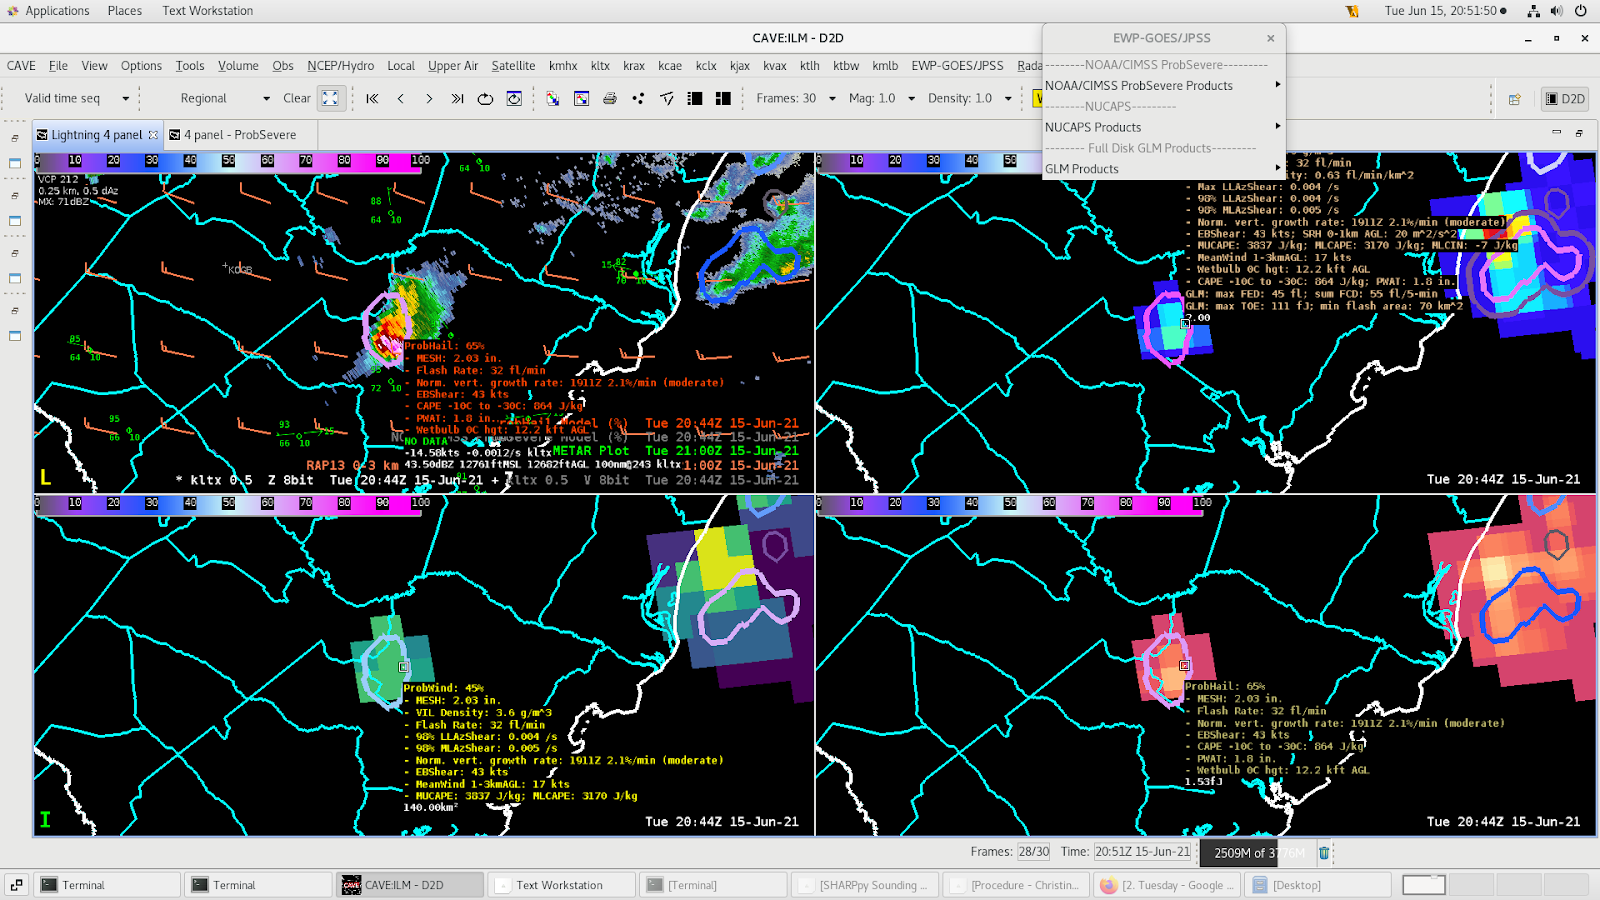
Three Body Scattered Spike & ProbHail
Three body scattered spike is visible in the storm in the top right panel.ProbHail shows values of ~65% when the three body scattered spike appears with MESH values over 2” supporting the likelihood of at least severe size hail in the discrete cell.
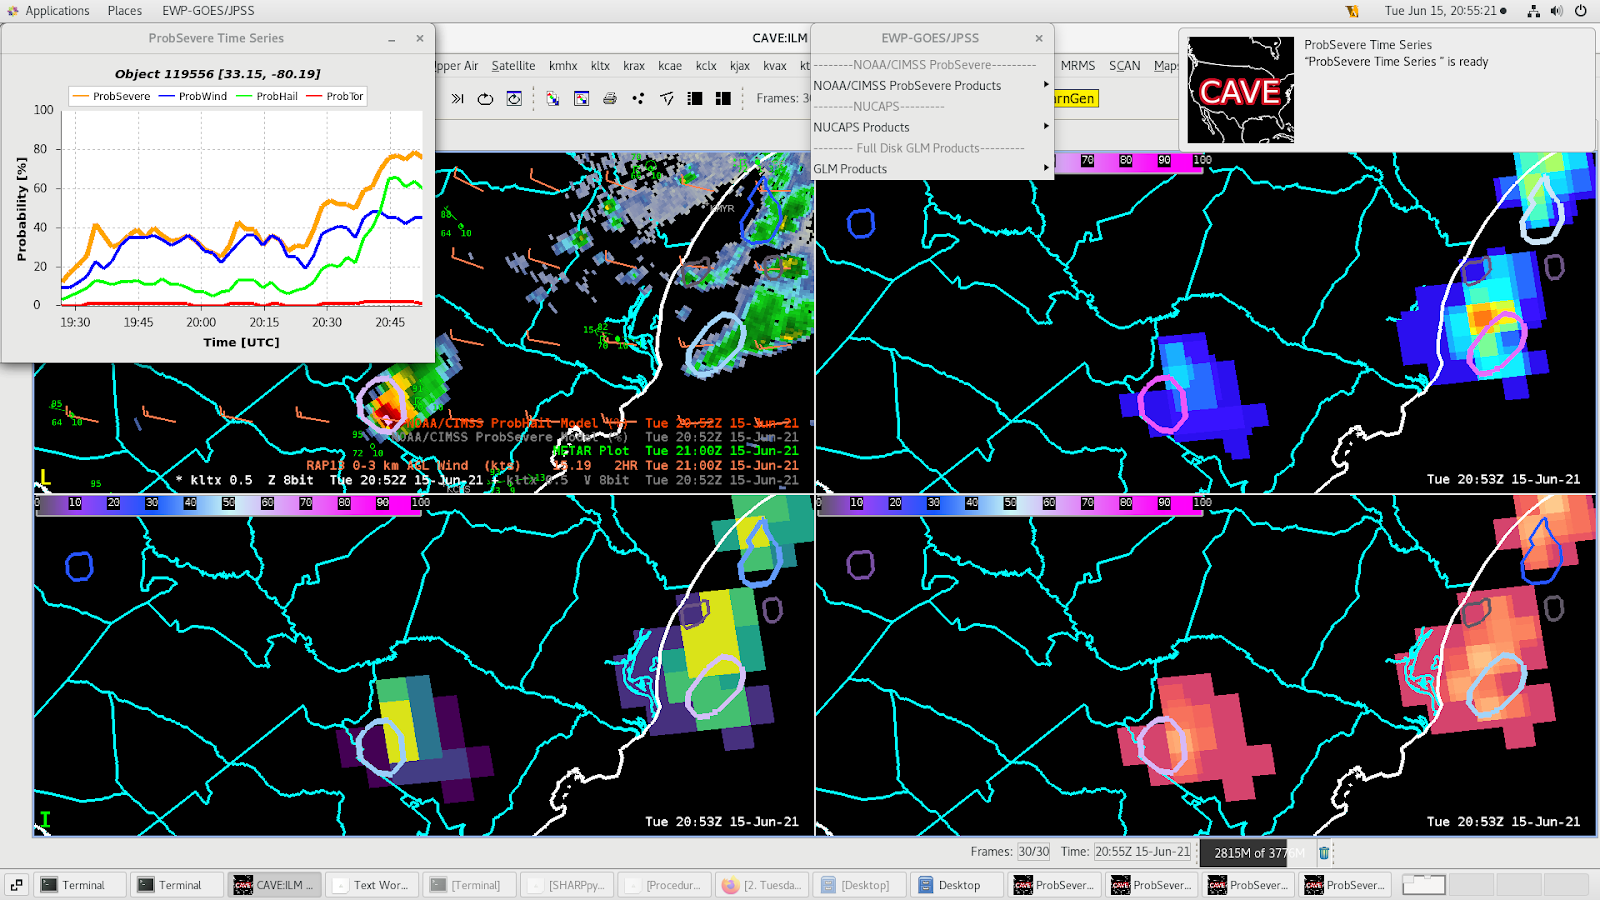
Watching the meteogram on this storm, we can see the probhail values jumped up to 65% over the last 15 minutes. It’s probably best to have ProbHail values of 60% or more last for a few volume scans because that suggests the residence time in the hail growth zone is long enough for hail to grow and become 1” in diameter or larger.