
Now that we have our one-minute forecast grids (warnings), our one-minute observation grids (“splatted” tornado locations), and our additional third grid to filter for CORRECT NULL forecasts (median filtered composite reflectivity), let’s combine them to fill our single 2×2 contingency table, shown here:
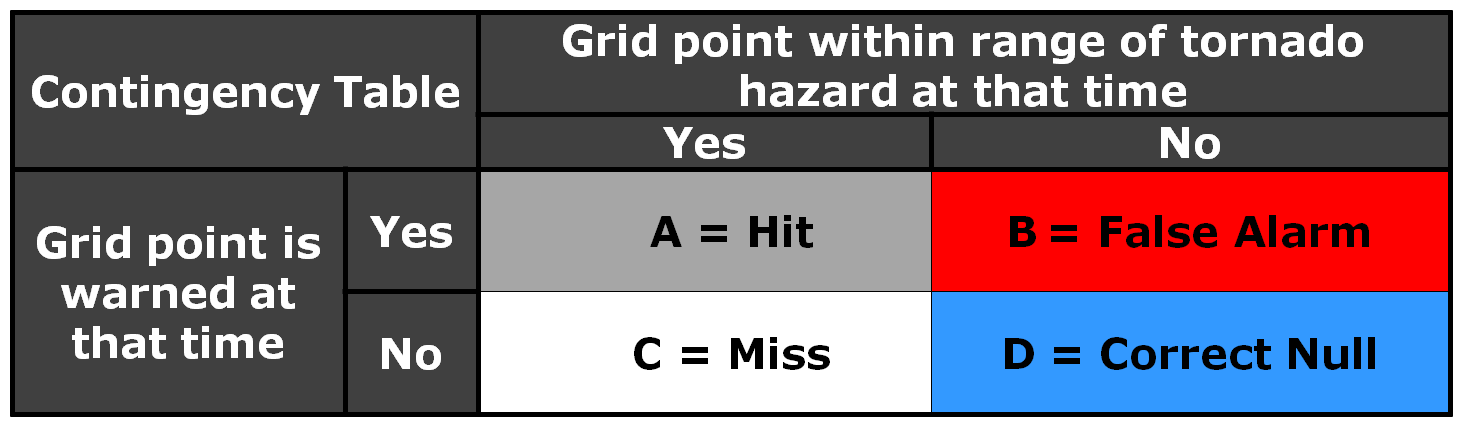
At each one-minute forecast interval, we can create these grid point values:
HIT: The grid point is warned AND the grid point is within the splat range of a tornado.
MISS: The grid point is not warned AND the grid point is within the splat range of a tornado
FALSE: The grid point is warned AND the grid point is outside the splat range of any tornado.
CORRECT NULL: All other grid points (outside warnings and outside tornado observations).
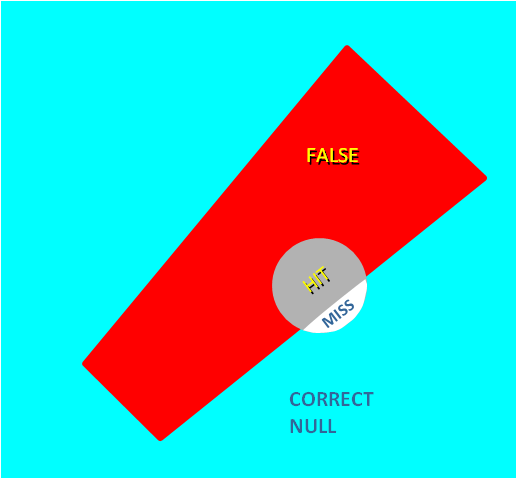
Viewing this graphically (the cyan CORRECT NULL area is supposed to fill the entire domain in this figure):
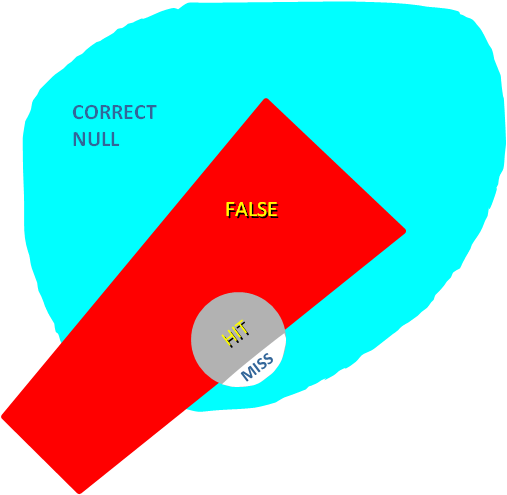
If we want to limit the number of grid points counted as CORRECT NULL, we can incorporate the third composite reflectivity grid:
CORRECT NULL: The grid point is not warned AND the grid point is outside the splat range of any tornado AND the grid point has a composite reflectivity value > 30 dBZ.
NON-EVENT: The grid point is not warned AND the grid point is outside the splat range of any tornado AND the grid point has a composite reflectivity value < 30 dBZ.
Viewing this graphically (the cyan CORRECT NULL area is only within the “storm area” in this version):
If we choose to score using a fuzzy representation of the observation based on the Cressman distance weighting scheme, the 2×2 table might look like this:
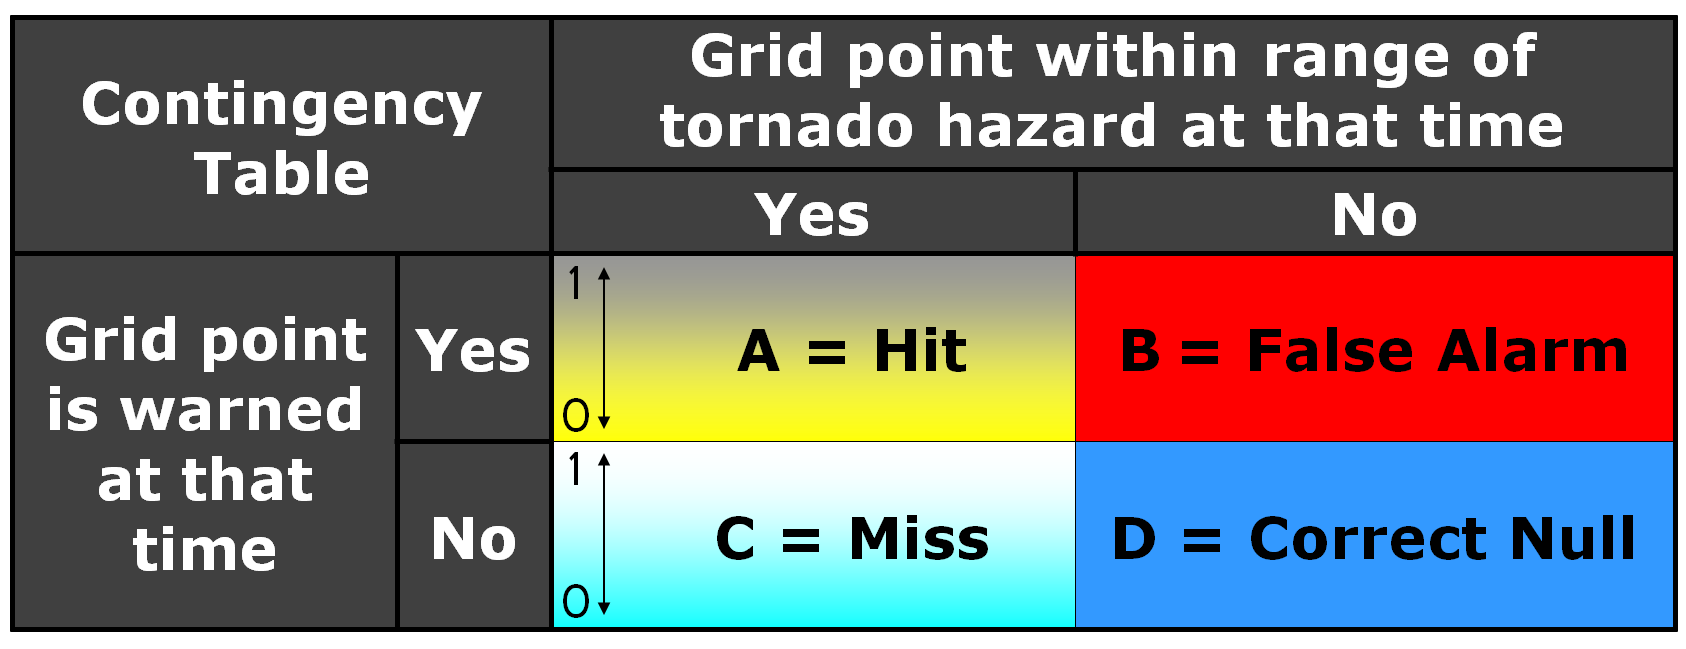
And the scoring categories become:
HIT: A value between 0 and 1 based on the Cressman weight value. At the center of the observation splat, this is 1. At the farther range of the splat, this is 0. The value is between 0 and 1 for locations between these two ranges.
MISS: A value between 0 and 1 based on the Cressman weight value. At the center of the observation splat, this is 1. At the farther range of the splat, this is 0.
FALSE: 1 – HIT. This value is 1 when grid is completely outside the splat range of any tornado observation. Within the splat range of a tornado observation, FALSE + HIT = 1.
CORRECT NULL: 1 – MISS. This value is 1 when grid is completely outside the splat range of any tornado observation. Note that the grid point must also have a composite reflectivity value > 30 dBZ. Within the splat range of a tornado observation, CORRECT NULL + MISS = 1.
NON-EVENT: The grid point is not warned AND the grid point is outside the splat range of any tornado AND the grid point has a composite reflectivity value < 30 dBZ.
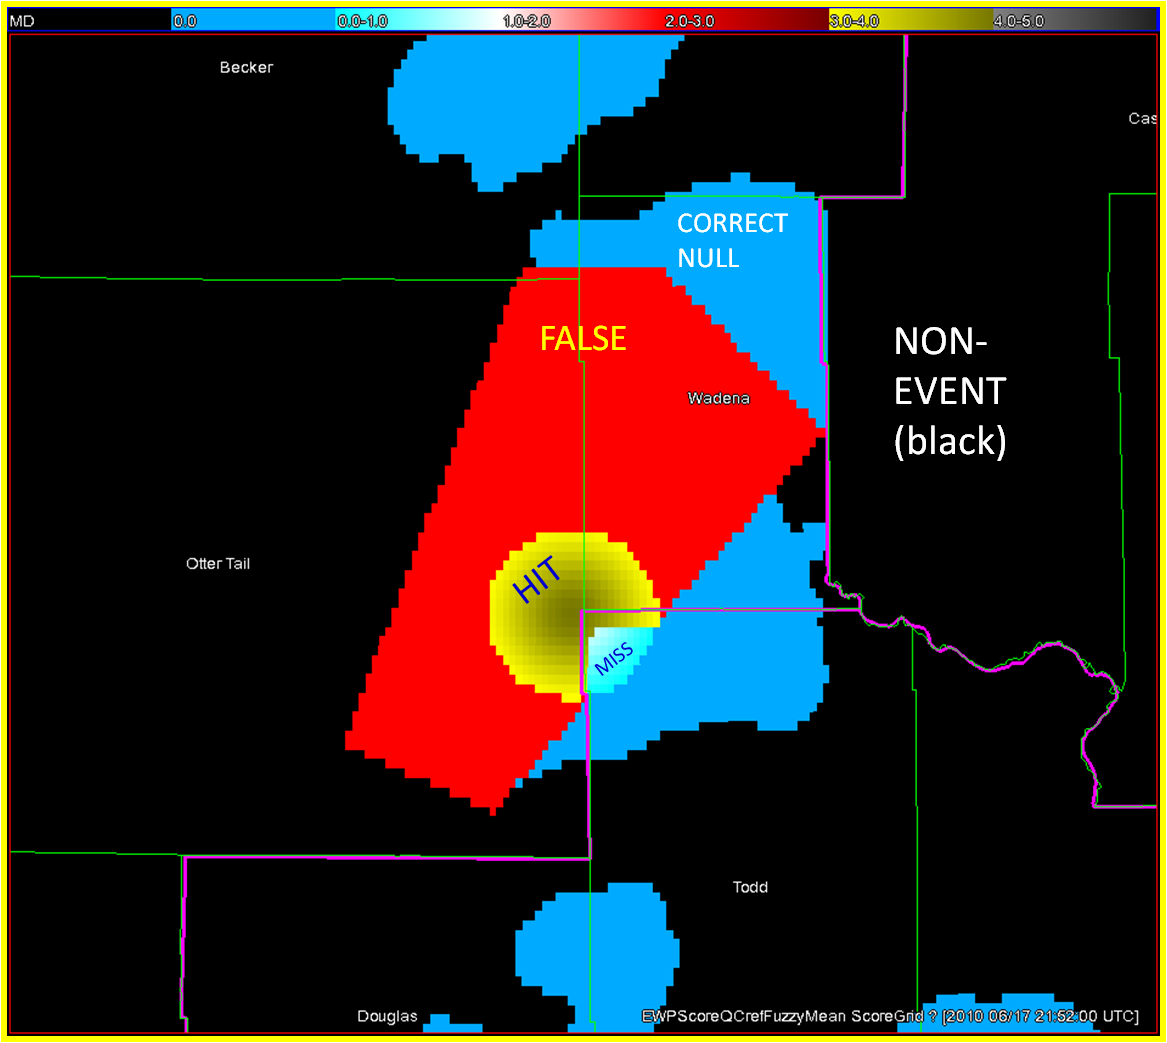
Viewing this graphically (using a different, but an actual event – 17 June 2010 Wadena, MN):
We can then run our 2×2 statistics on each one-minute interval during a warned tornado event and accumulate them for the entire event. The results can be somewhat surprising, and they will need some interpretation. That will be the subject of the next blog entry.
Greg Stumpf, CIMMS and NWS/MDL