We’ve just wrapped up day 10 of TORUS operations in the eastern Texas panhandle. There have been a couple down days sprinkled in, but overall we have been running hard for this campaign. The weather pattern has been conducive for supercell thunderstorms since we started, so almost everyday has brought an opportunity to collect data. In these first 10 days, the TORUS team has already had a few pretty successful missions!
TORUS stands for Targeted Observations by Radar and UAS (Unmanned Aircraft Systems) of Supercells, which means we focus on collecting measurements in and around these powerful thunderstorms (both with and without tornadoes). The armada is large with ground and aerial teams from the National Atmospheric and Oceanic Administration (NOAA), the National Severe Storms Laboratory (NSSL) and OU Cooperative Institute for Mesoscale Meteorological Studies (CIMMS), the University of Colorado – Boulder (CUBoulder), the University of Nebraska – Lincoln (UNL), and Texas Tech University. More information and links about the project can be found here.
I’m part of the CIMMS/NSSL team and my main role is to operate the mobile LiDAR in the environment near supercells. I’ve shared some pictures of our vehicle before, but know it is complete and field-christened.

The LiDAR is mounted on the back of a pickup truck inside a protective box with a removable lid. We can drive with the LiDAR scanning but with the lid closed to protect it during transit to allow for quick deployments in these rapidly evolving environments. Our truck is also outfitted with a mobile mesonet rack to measure surface conditions, a hailcage – just in case, dual-sounding units so we can launch weather balloons every 30 minutes if needed, and a plethora of communication and data equipment.
I’m typically stationed in the back seat surrounded by four monitors: my own laptop for LiDAR processing and deployment logging, a large monitor for LiDAR control and data visualization, and two laptops to control and monitor each component of the dual-sounding system. It’s a little tight, and can be overwhelming at times, but I have learned I don’t get as carsick as I used to!
On a typical deployment, we try to set up on the south-southeast side of a supercell thunderstorm with a mesocyclone about 50 kilometers away. Since the LiDAR scans small particles like dust or aerosol, we need to stay out of the rain. Precipitation blinds the LiDAR. We set up and the LiDAR starts its scan pattern: typically we stare straight up for 2 minutes then do a conical scan, which allows up to retrieve the horizontal wind profile. We can also do special scans like vertical slices (RHIs). We want to stay in that position and allow the storm and it’s mesocyclone (with or without an associated tornado) approach us. In a perfect deployment, the mesocyclone (and any associated tornado) will pass to our north and we remain in the clear-air near field. However, that is a hard forecast to make, so sometimes we have to pack up quick and bailout!
On 23 May 2019, we collected a great LiDAR dataset on the storms that ended up producing at least one tornado in Lipscomb County, Texas (storm reports). We collected around 3 hours of LiDAR data as the storms formed and moved into the area. Here, I’m sharing some preliminary (and thus non-quality checked) data from our deployment.
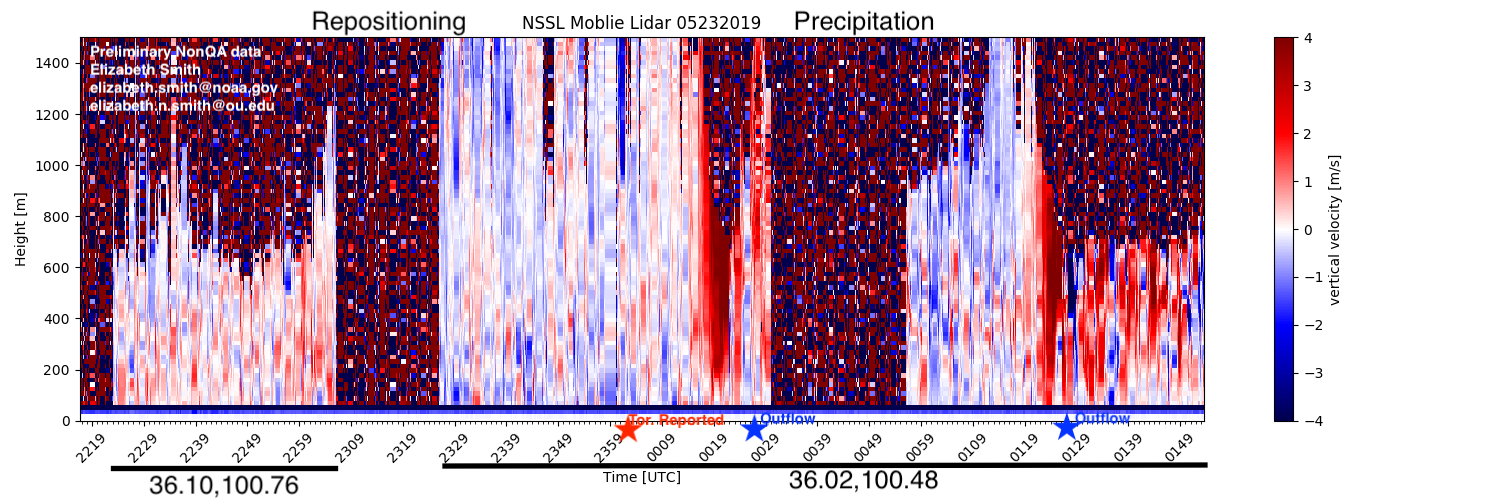
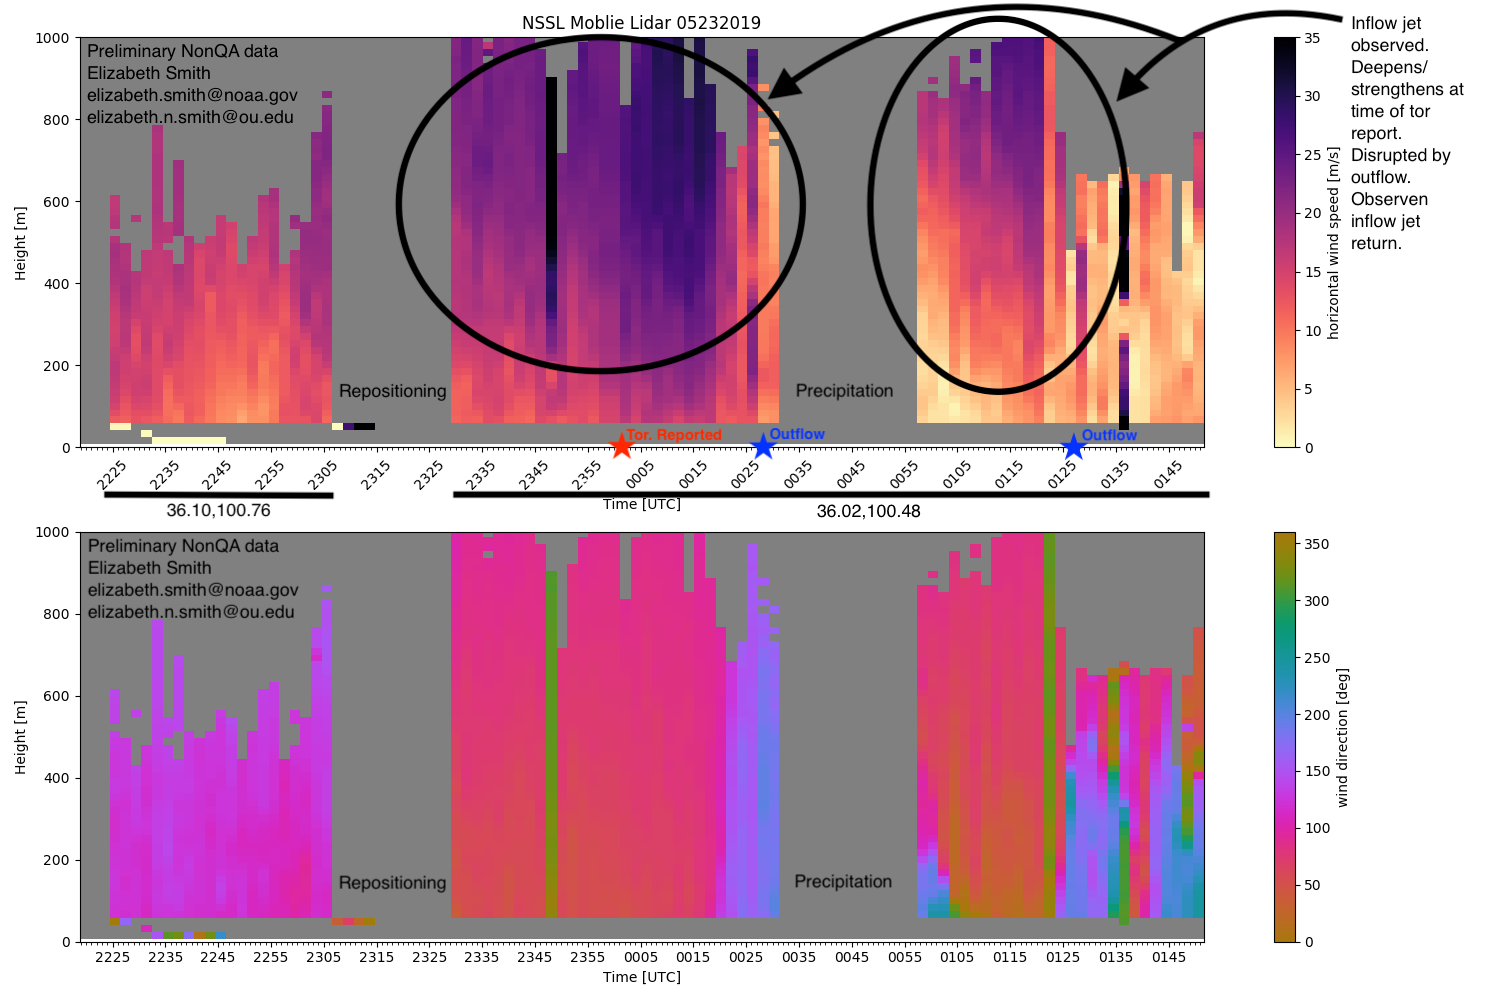
These data are largely unprecedented and exciting! We were able to collect data before and during the tornado event. Some highlights: in the vertical velocity field, we observed these persistent and deep updrafts (red blobs) ahead of multiple outflow boundaries; we were able to observe the inflow jet ahead of the supercell strengthening, deepening, and recovering after a disruption by cool outflow air.
In addition to the LiDAR observations, we also do soundings. Here’s a fun video captured by my friend Manda Chasteen (OU School of Meteorology/CIMMS/NSSL) showing me launching a weather balloon into some intense inflow winds on 17 May 2019 near Lexington, Nebraska.
https://twitter.com/theweathermanda/status/1129615853484466177
I don’t know much about what all of these data mean yet, but I am excited to collect more and learn something new about our incredible atmosphere. Happy cloud viewing to all!