If you have an interest in severe and unusual weather, you probably already know all about the hailstorm that struck Denver on Monday afternoon, shattering windows and damaging vehicles and roofs across the metro. Indeed, it made for quite the exciting Monday in the Spring Forecasting Experiment.
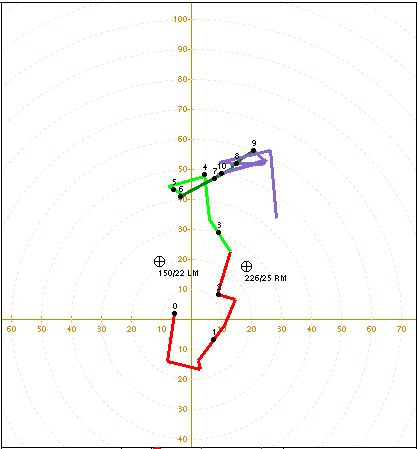
During the morning forecast discussion, participants noted that good forcing was present over Colorado, along with dewpoints considered sufficient for severe convection by Colorado standards (in the 50’s). The moisture was modified Gulf moisture, arriving in CO by way of the Rio Grande thanks to the surface front that was the focus of most of last week’s severe convection. Also noted was the unidirectional shear, as can be seen on this 1200 UTC (7:00AM CDT) hodograph from Albuquerque, which was upstream of Denver at 250mb and 500mb.
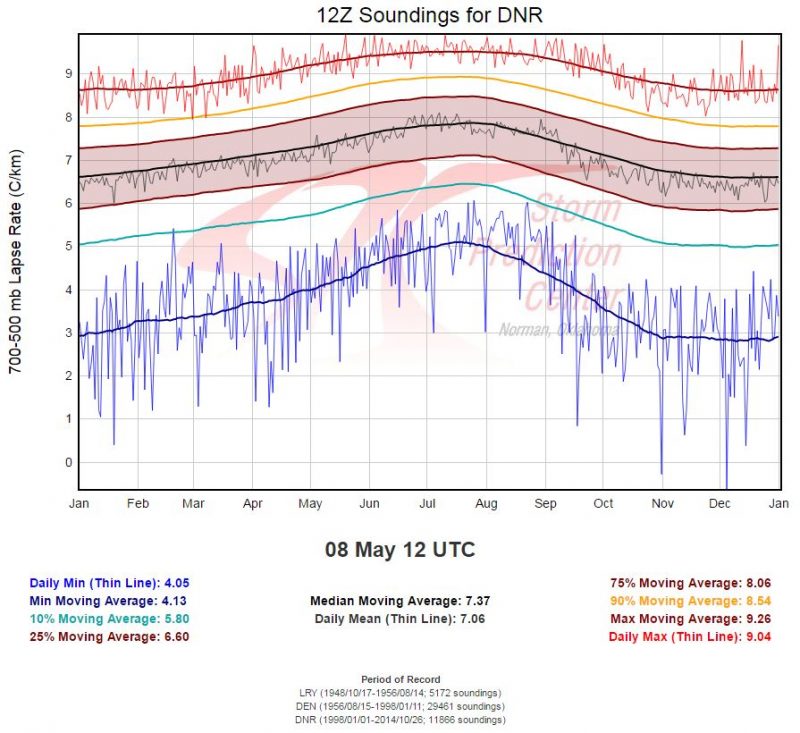
In addition to the favorable upstream dynamics, the other severe weather ingredient present in abundance was the lapse rates, as can be seen on the Denver, CO 1200 UTC upper-air sounding:
These lapse rates, around 8.1°C/km, are on the higher end of the climatology for Denver, between the 75th and 90th percentile of 12Z soundings. Certainly, they would prove sufficient to support the later hailstorms.
Looking at the operational models, the upper level pattern seemed to be relatively stagnant throughout our period. Although the shear was forecast to be relatively meager by central Oklahoma standards, several participants from the Colorado area confirmed that this shear was often sufficient to get supercells in Colorado. The operational models also showed convection in our area of interest, despite a warm layer aloft.
Looking at the convection-allowing models, they were relatively consistent in the timing and placement of convection, with similar areas of high reflectivity. Long tracks of updraft helicity (which we look for to indicate supercells) were relatively sparse within the models.
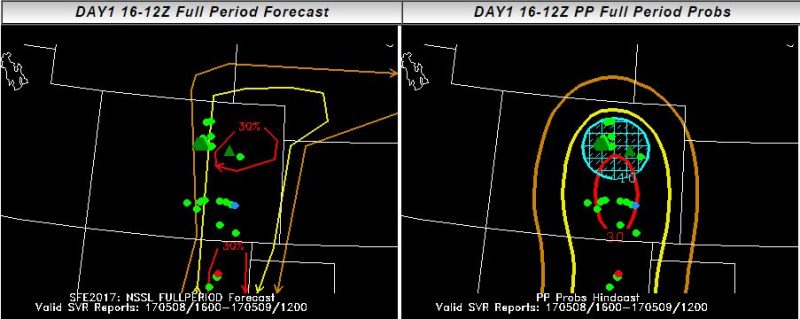
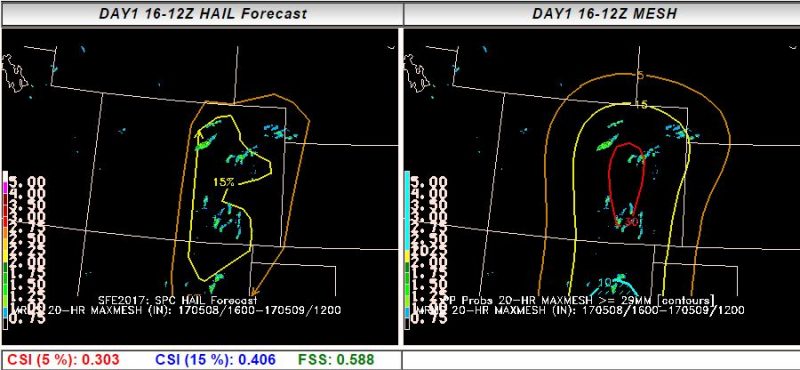
With the divergent information, it was difficult to determine which threat would be the most prevalent. The Innovation Desk, which is concerned with all hazards grouped together, thought that wind would be the largest threat, although some potential for hail was included in the forecast:
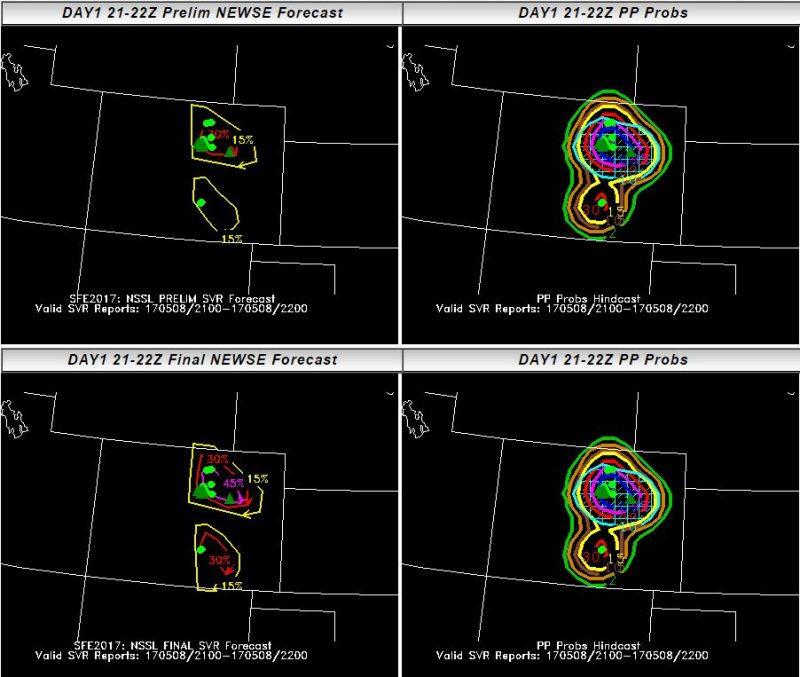
However, the convection-allowing ensembles suggested that the storms would move off the mountains more quickly than what actually occurred, resulting in the probabilistic forecast being focused too far east. The “practically perfect” forecast on the right here illustrates an interesting point about the forecasts – with so many large hail reports in Denver, why doesn’t the 30% extend that far north? Well, the practically perfect forecasts are designed to minimize the effect of metropolitan areas – having tens or hundreds of reports in the same area would result in unrealistically high probabilities.
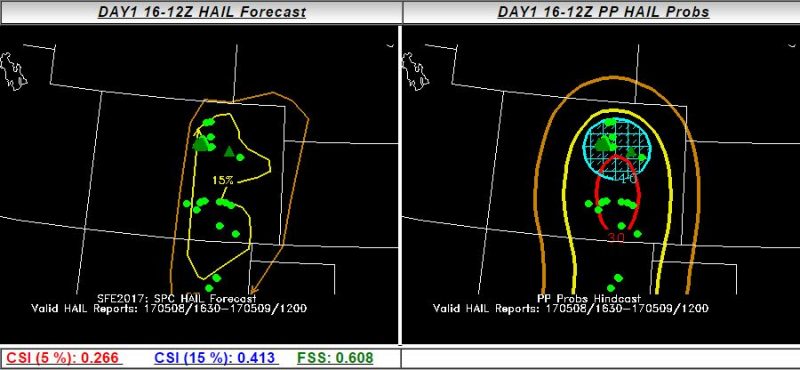
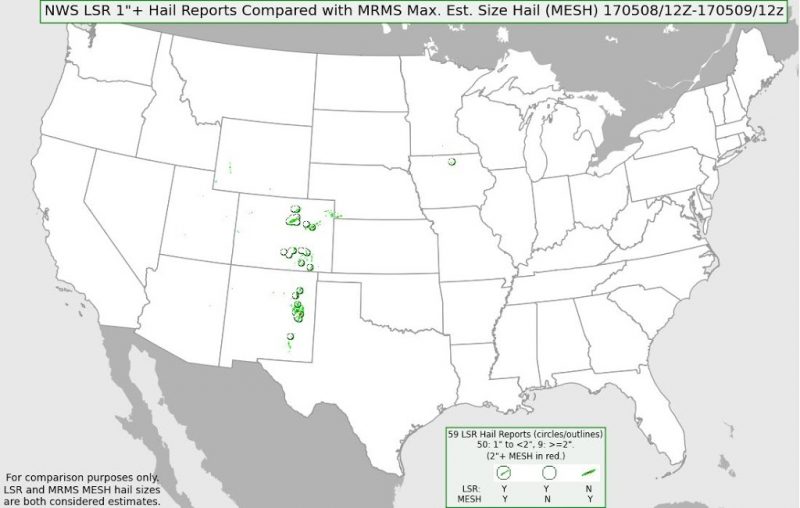
The Individual Hazards desk, which focuses on the separate threats of hail, wind, and tornadoes, had their probabilities slightly farther west than the individual hazards desk, and were able to capture more of the reports within the contours. The Individual Hazards desk also took a look at verifying the forecast with Local Storm Reports (the green dots and triangles) or with the Maximum Estimated Size of Hail (MESH):
In this case, the practically perfect forecasts looked quite similar, although the MESH practically perfect probabilities omit the area of significant (2″+) hail and are slightly farther north, encompassing the less-populated area of northeastern Colorado in the 15% contour.
The first shorter-term forecast issued in the afternoon by the Innovation Desk using the NEWS-e was perhaps the most accurate forecast issued by either desk, correctly honing in on the severity of the Denver storms, which had initiated by the time of the forecast. The update (the lower panels) increased the probabilities to 45%, which was a good forecast. Since these forecasts are over a shorter time period, calibration to what a forecast should look like at this time scale is still taking place!
Next-day evaluations of hail guidance told interesting stories, with the HAILCAST hail forecasting method doing better over the southern extent of our domain and the updraft speed method doing better across the northern extent of the domain, although it tended to overestimate the amount of hail that would be present.
A preliminary map of the hail reports plotted over the MESH tells the large-scale picture of the day – many hail reports over most of the area where MESH indicated hail occurring, but for the sparsely populated northeastern Colorado. But as the citizens of Denver know, it only takes one storm to have a large effect when considering a densely populated metropolitan area.

